
.svg)
%2Bcopy.avif)

.webp)
.svg)
.webp)

.jpg)
%20(1).jpeg)
.jpg)
In 2021, shared micromobility bounced back. Despite a 70% collapse in travel the year before, 112m shared micromobility trips were taken in the US alone. By 2023, the sector had expanded to 452 cities across 15 regions worldwide, facilitating over 87k trips every single day.
The numbers are easy to read as a success story. But there's a more interesting question underneath them. Are these trips actually doing what micromobility was supposed to do?
The Idea Promised
The idea has always been elegant. You leave home, hop on a shared e-scooter or bike, ride three minutes to the metro, take the train across the city, then grab another scooter for the final stretch to your office. Door-to-door, no car required.
It's a genuinely good idea. Researchers call it the hybrid mode concept, treating micromobility and public transit not as separate options but as a single trip chain. The logic holds up. Micromobility offers flexibility and door-to-door reach. Public transport offers speed and scale. Together, they can theoretically match what a private car provides, without the car.
The problem is that "theoretically" is doing a lot of work in that sentence.
The first and last mile, in practice
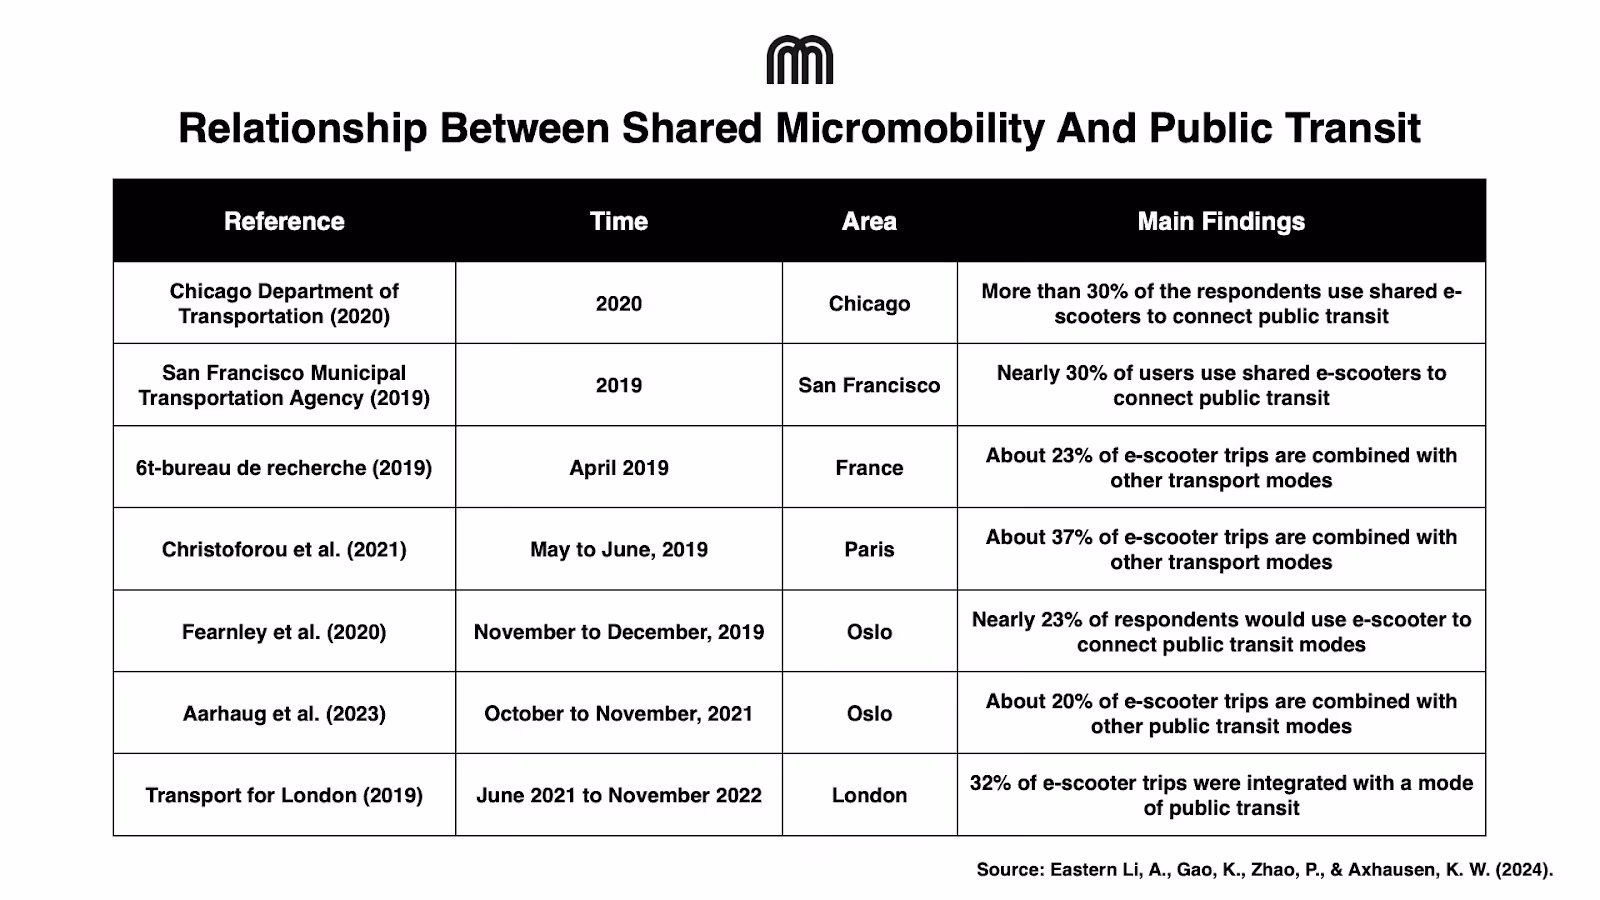
There's a wide range of estimates on how often people use shared micromobility to connect to transit. NABSA's 2024 State of the Industry report put 74% of riders using shared micromobility to connect to transit, up from 63% in 2021, with 18% of all shared trips made specifically for that purpose. Compelling, but those figures came primarily from operator-run surveys.
When public agencies and academic researchers conducted their own studies, the numbers looked different. The range across those studies ran from 4% to 39%, a spread wide enough to suggest that the answer depends heavily on where you are, what transit looks like, and how you ask the question.
A 2024 study analysed vehicle availability data from e-scooter systems across 124 European cities, over 108m trips in total. Integration ratios ranged from 5.59% to 51.40%, with a mean of 31.58%. In more than 76 of the 124 cities, over 30% of e-scooter trips were integrated with public transit.
But the variation is the real story. Oxford came in at over 50%. Corby, also in the UK, sat at 5.59%. Same country, very different outcomes.
There's also a methodological problem worth noting. Most research uses a buffer-zone approach: if a trip starts or ends within 50 to 250 metres of a transit stop, it's counted as a connecting trip. Research using self-reported data from Washington, DC, found that real connecting trips differed meaningfully from inferred ones. The standard method may be producing estimates that are systematically off, in either direction.
What makes it work and what gets in the way

The 124-city study pointed to one factor above others - transit stop density. Cities with more stops per square kilometre saw higher integration rates, which makes intuitive sense. If transit is accessible, it's worth connecting to. Trip data also shows a clear proximity effect, transfer rates grow for distances of 100 to 500 metres from stations, then drop sharply beyond that. Integration isn't a uniform feature of micromobility. It's something that happens in some cities and barely at all in others, and the built environment is largely what decides it.
Safety is probably the biggest barrier, and it operates on two levels. The first is perceived safety on the road. Research modelling e-scooter routing in Athens found that at certain safety thresholds, the algorithm couldn't find a safe path at all, the network of links perceived as safe simply didn't connect. The dual nature of e-scooters, able to use both road and pavement, creates its own complications. Flexibility in theory. In practice, it produces uncertainty about where riding is permitted, inconsistent enforcement, and safety concerns for both riders and pedestrians.
The second level is infrastructure at transit stops themselves. Secure, convenient, affordable parking for micro-vehicles at stations is one of the most consistently cited factors in whether people choose micromobility for access trips. When it's absent, or when the designated spots are too far from the station entrance, the friction adds up. For a closer look at how parking policy specifically has shaped these outcomes across European cities, see our earlier piece on the topic.
Pricing and accessibility create additional barriers, particularly for lower-income users. Shared service costs, when not subsidised, can make the integrated trip chain more expensive than it appears on paper. Studies in multiple cities have found that equitable access to both the transit system and the shared micromobility layer requires active policy attention. And then there's the governance problem. In most cities, micromobility and public transit are planned by different agencies with different incentive structures. The integrated trip chain that works so well in theory requires coordination that isn't structurally built in anywhere.
The environmental picture
The environmental case for micromobility-transit integration is real, but it comes with a condition attached.
Empirical and modelling studies consistently find that micromobility reduces CO₂ emissions, energy consumption, and local externalities compared to conventional motorised transport, particularly diesel-based alternatives. E-bike sales in the US grew from under 300k annually in 2018 to over 1m by 2021, and unlike conventional bike sales, that growth has held post-pandemic. Something about the format, lower physical effort, greater range, unlocked a different population of users.
But the environmental benefit depends entirely on what micromobility is replacing. A trip that substitutes for a car journey is a meaningfully different thing from one that substitutes for a walk or a bus ride. The gains are real in the first case, marginal or absent in the second.
This is where integration matters most. A micromobility trip that extends someone's transit reach, making a journey possible that would otherwise have required a car, is the use case with the clearest environmental logic.
The potential is significant. The delivery mechanism is integration. And integration, as the evidence keeps showing, is the part that's still being figured out.
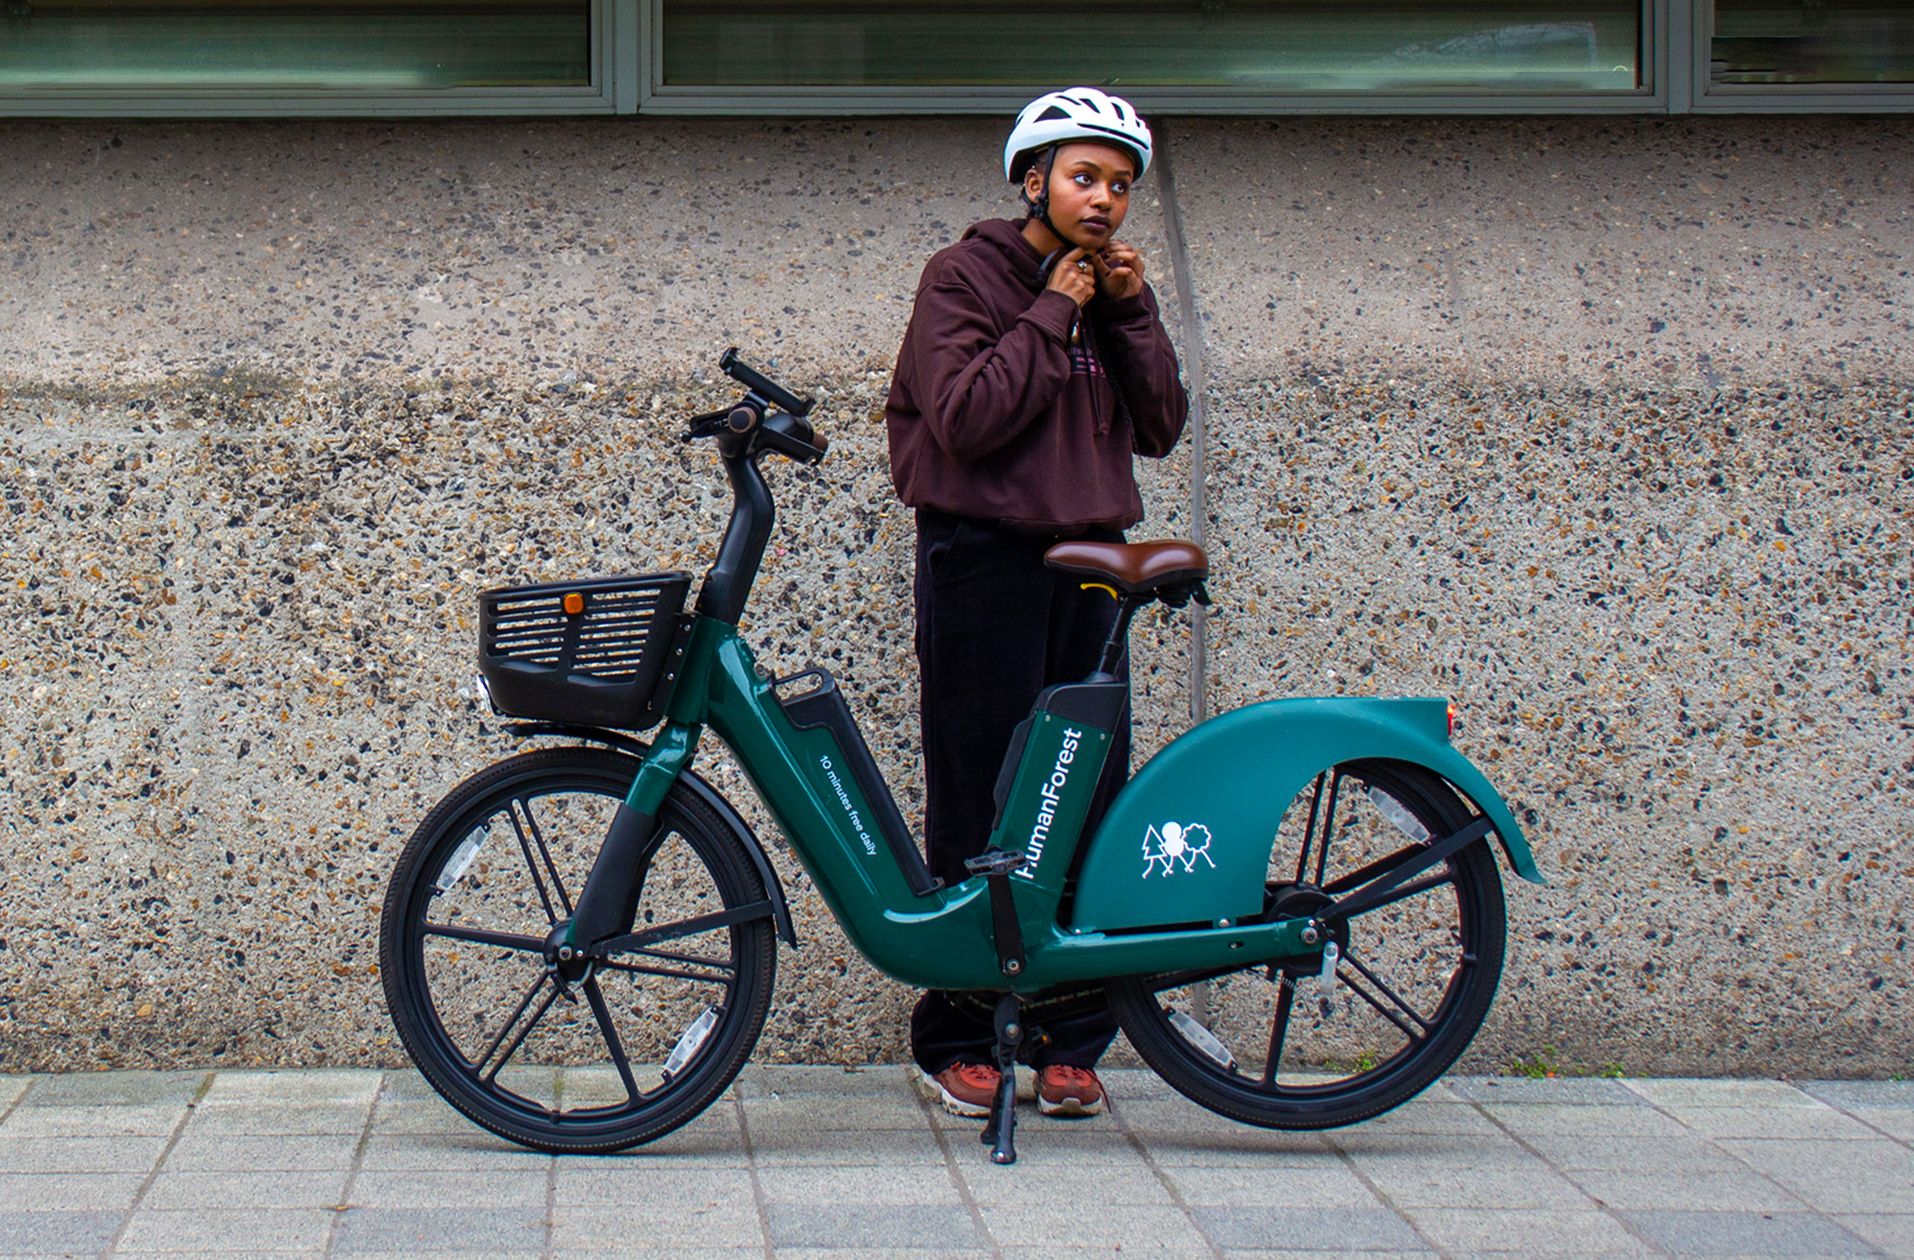
Cover image credits: Lime


