
.svg)
%2Bcopy.avif)


.svg)
.jpg)


.jpg)
%20(1).jpeg)
.jpg)
Contents
- About Swapfiets
- Operations
- Ownership Structure
- 2024 Financial Performance
- Chart: Net Revenue vs Net Result ( 2018 to 2024), Revenue Split by Region (2024)
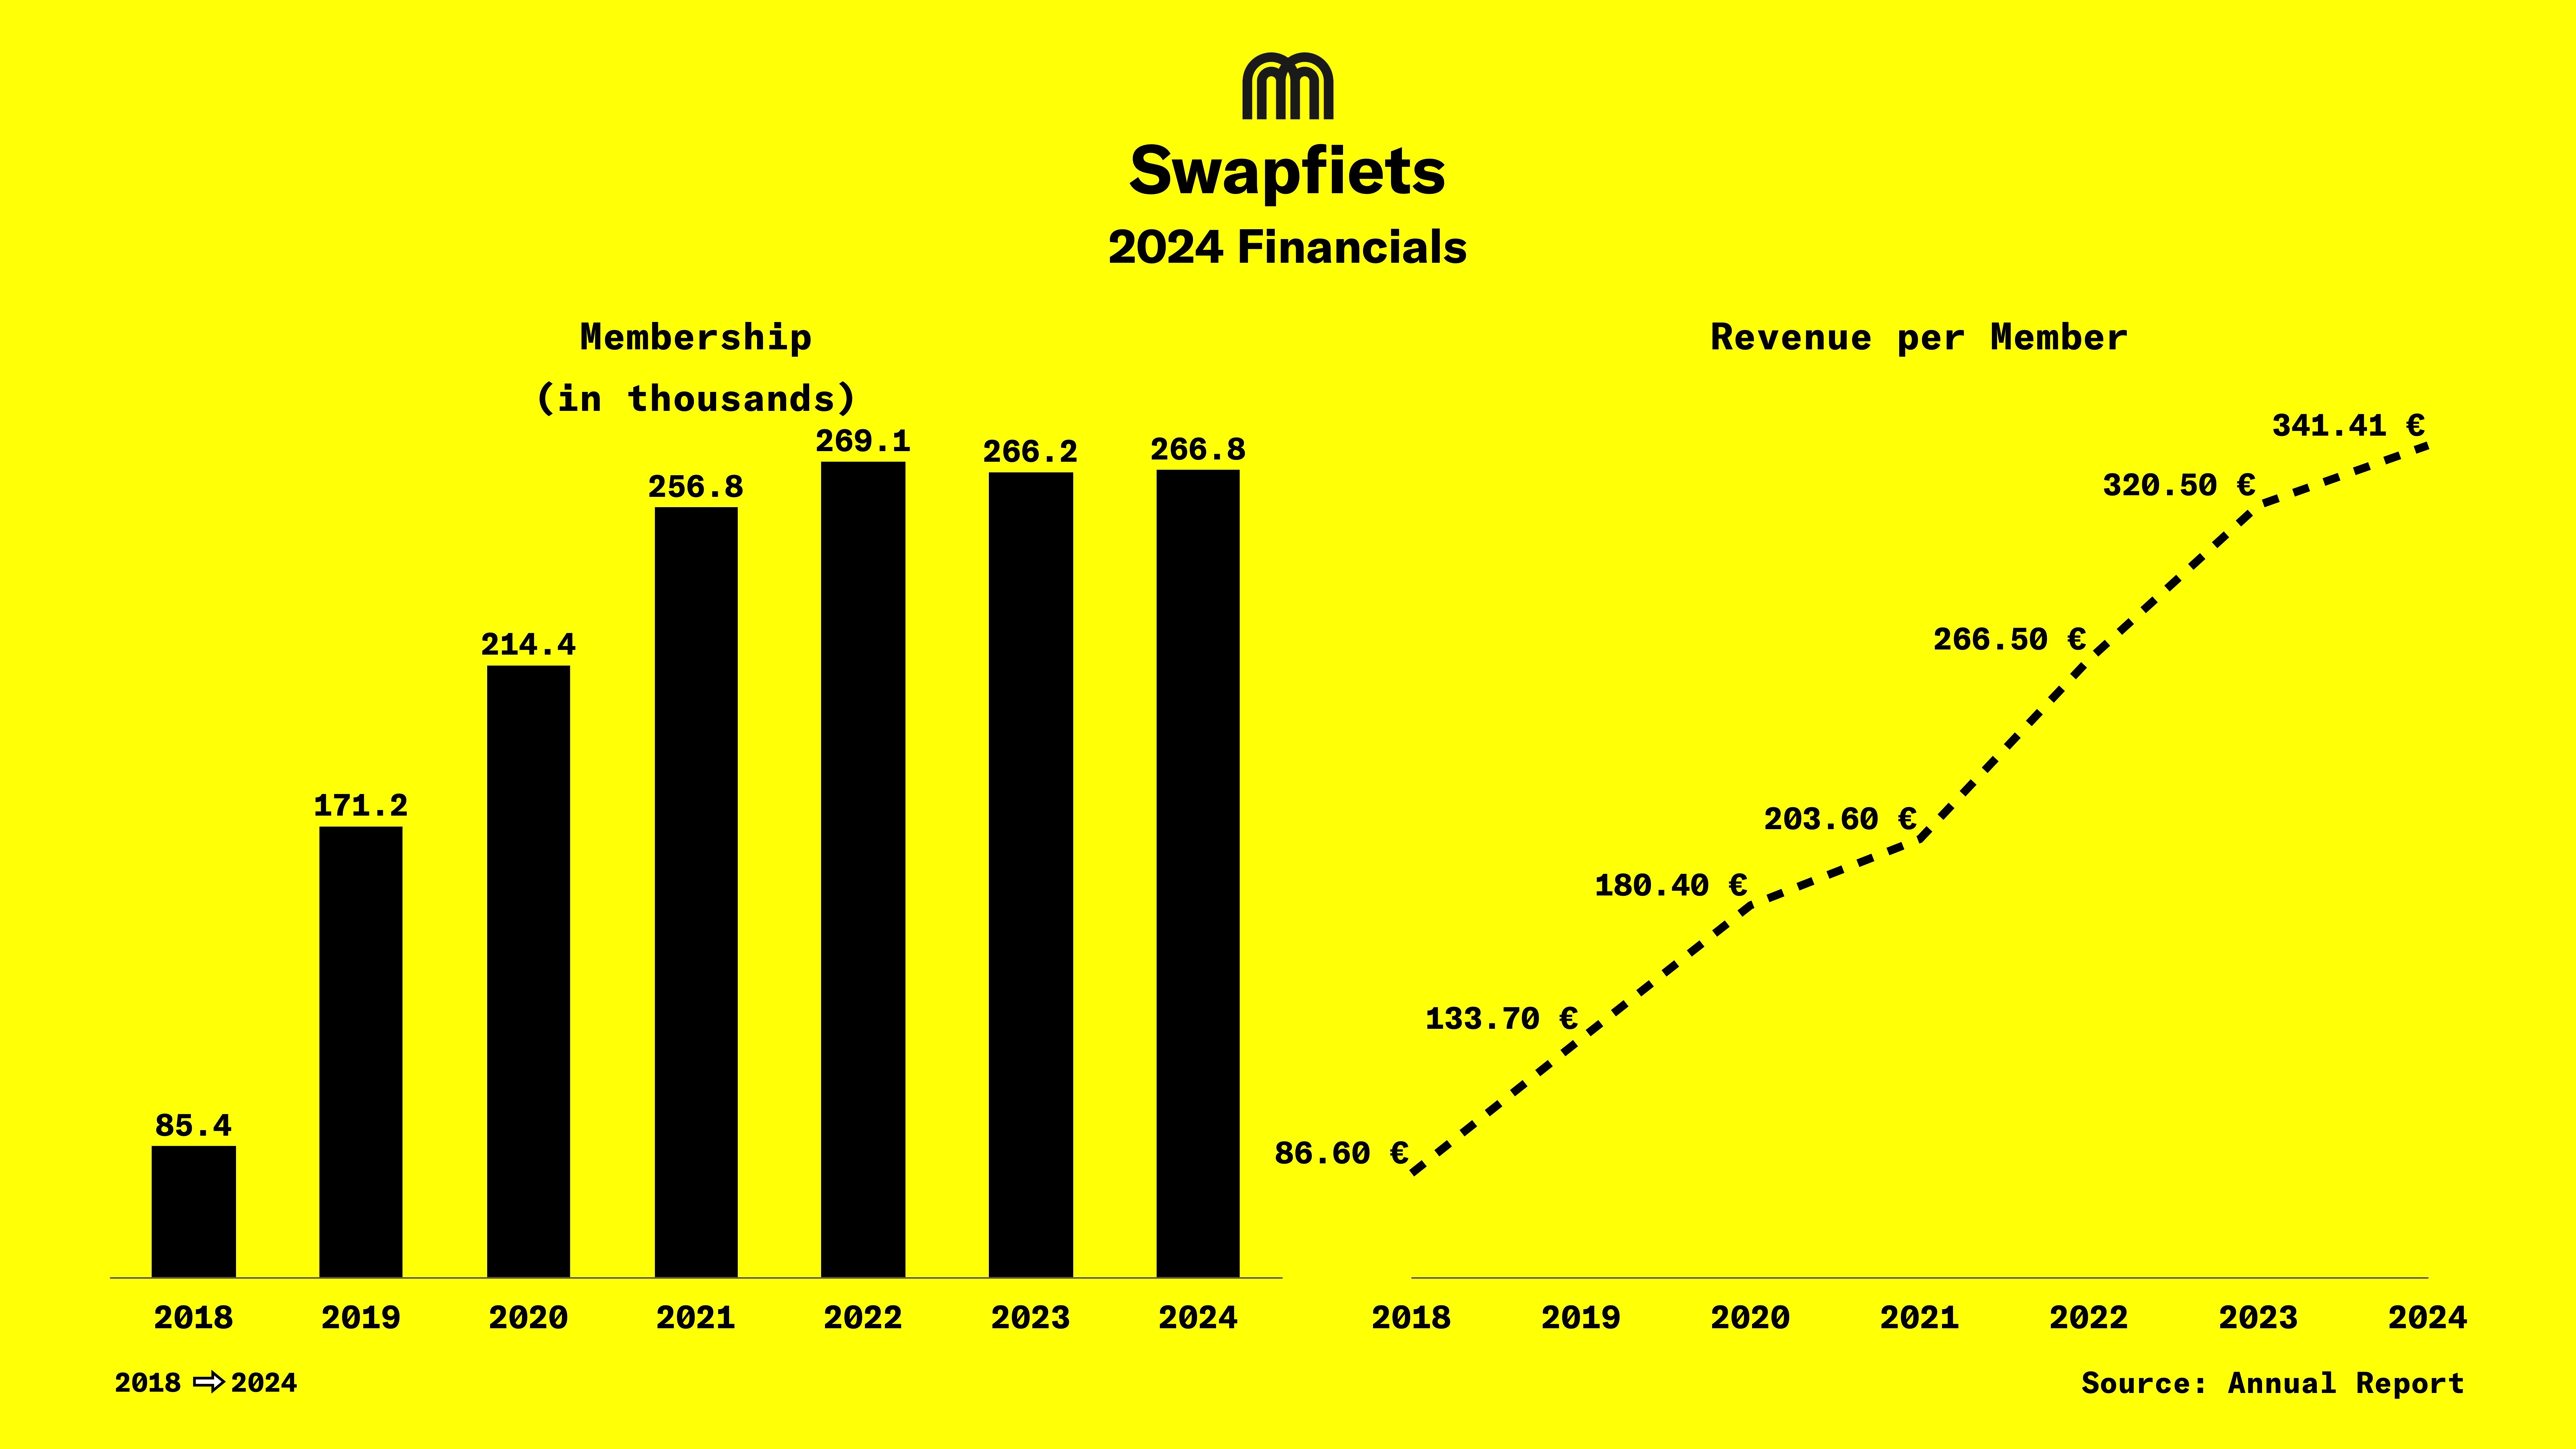
- Chart: Membership, Average Revenue Per Member (2018-2024)
- Revenue Breakdown by Geography
- Cost Structure and Cost Reductions
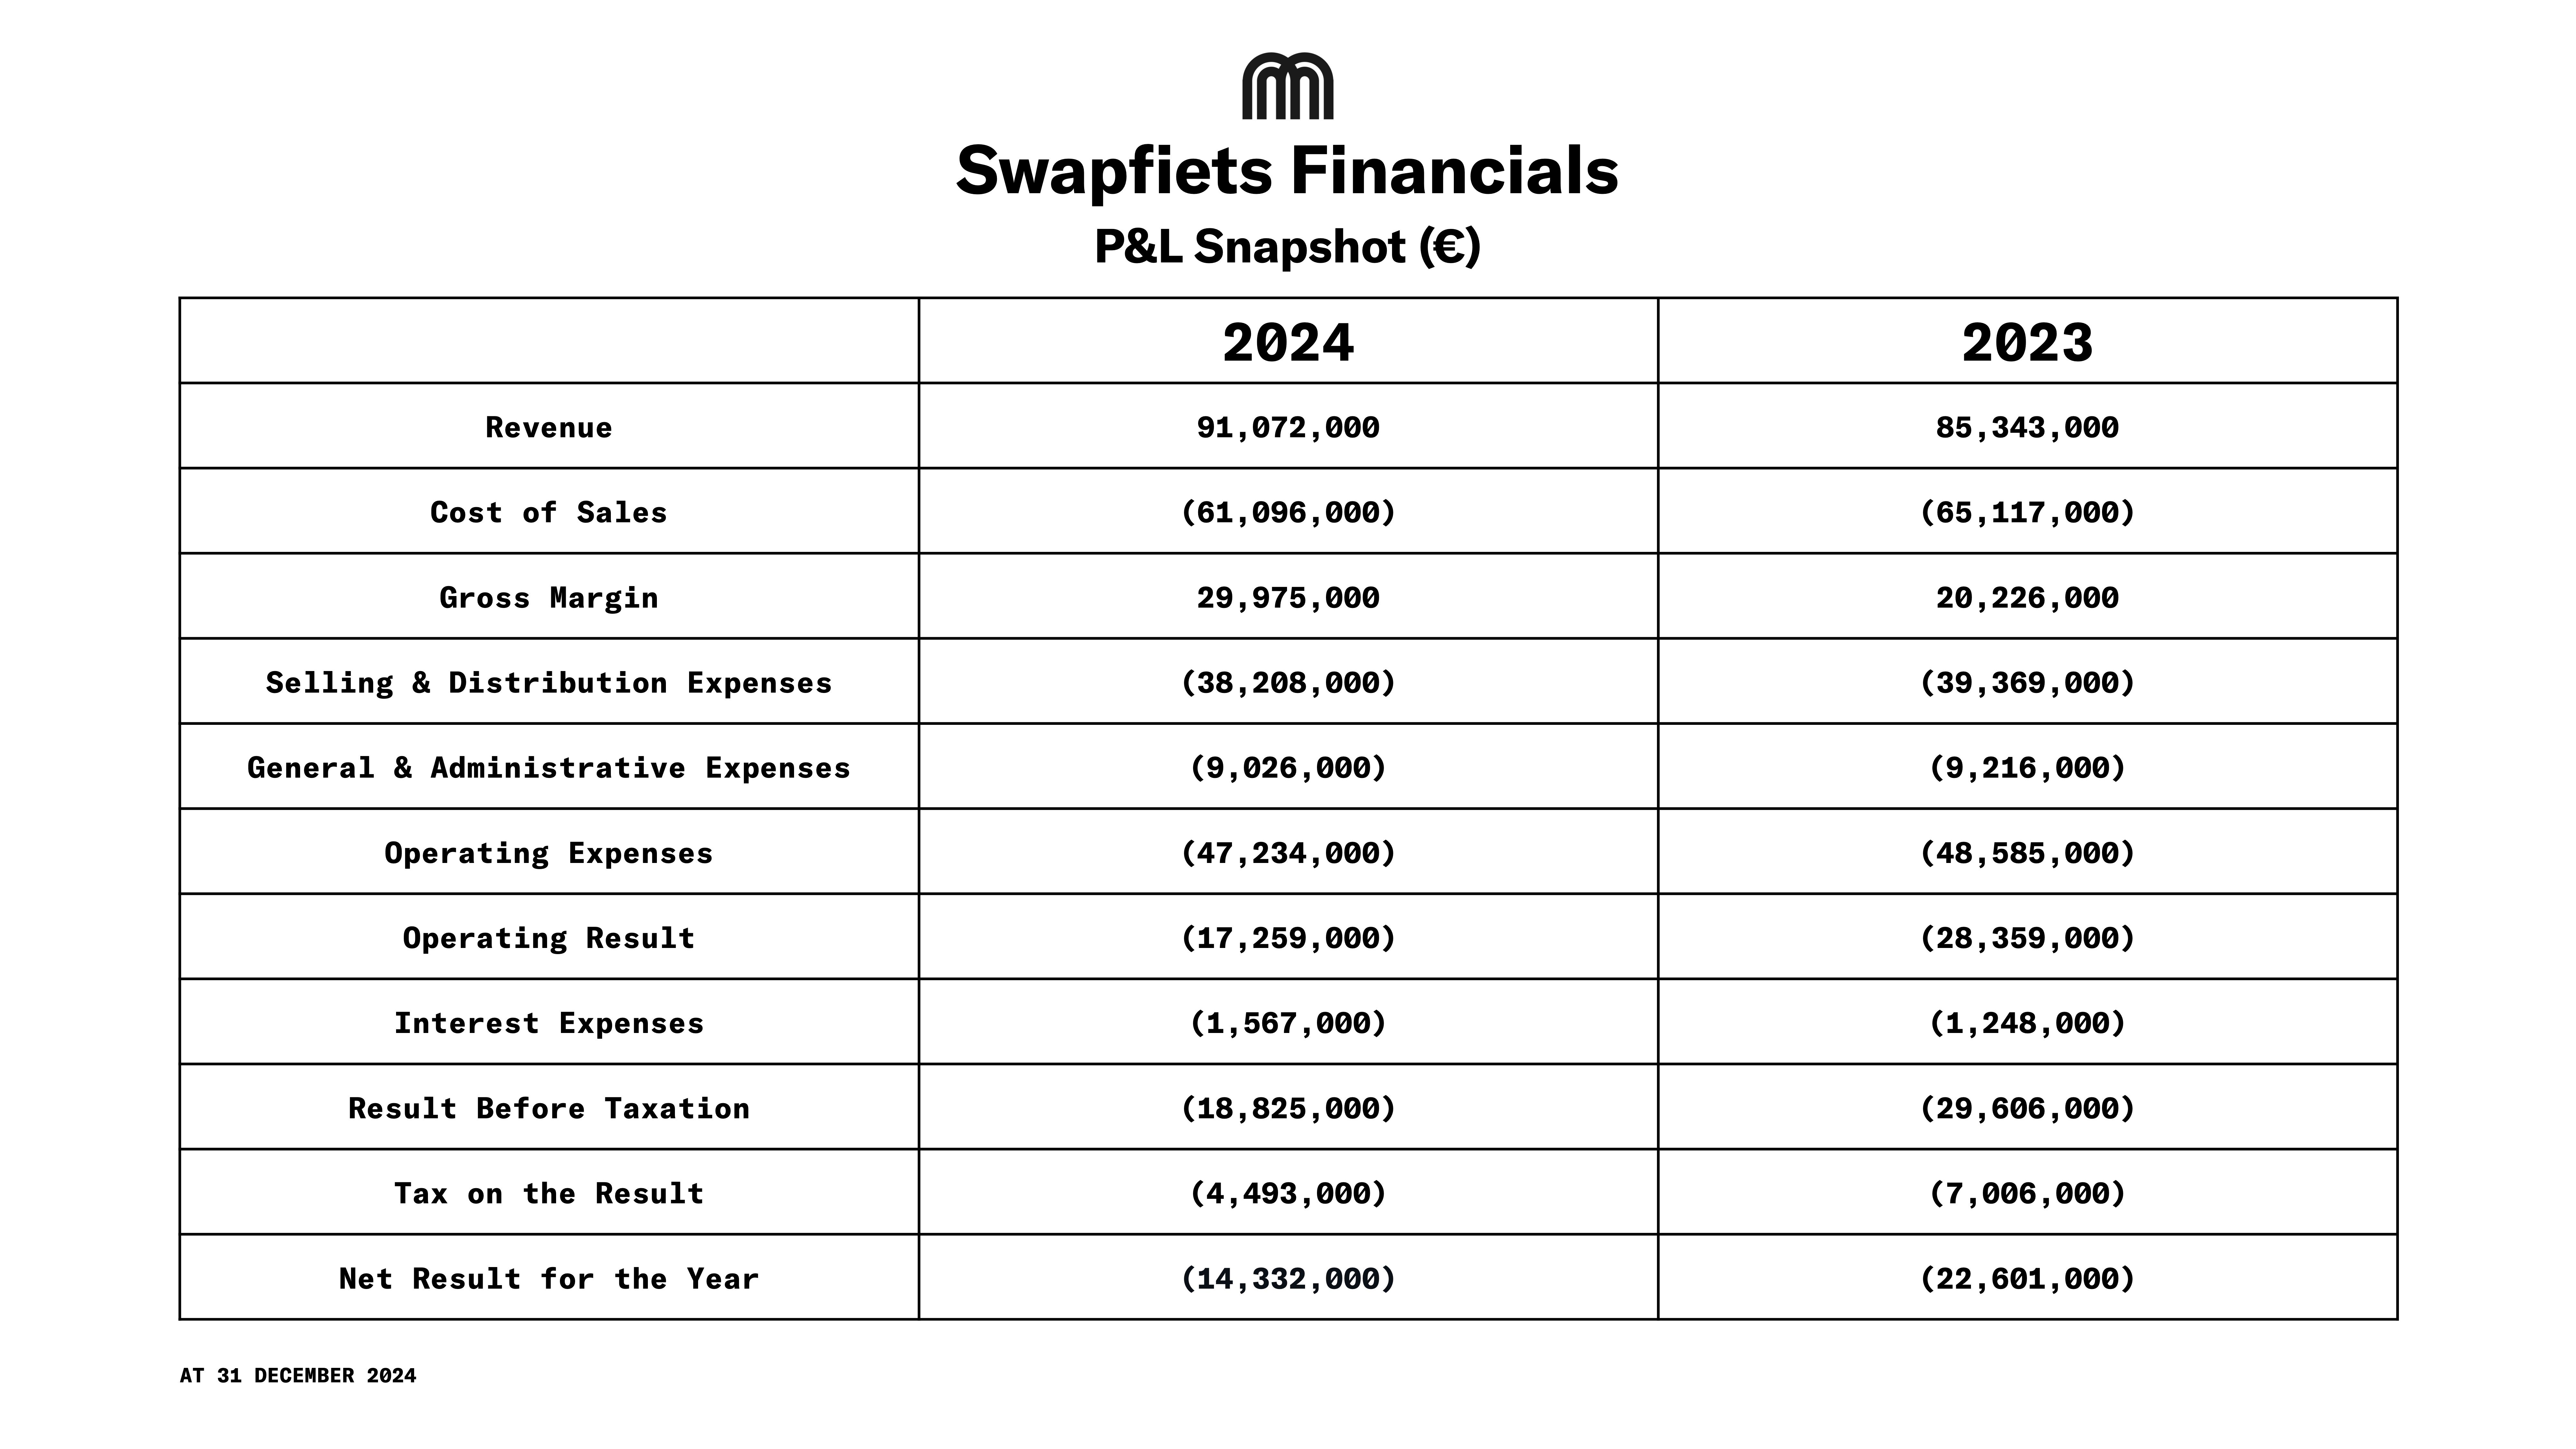
- Table: P&L Snapshot
- Cash Position & Debt Restructuring
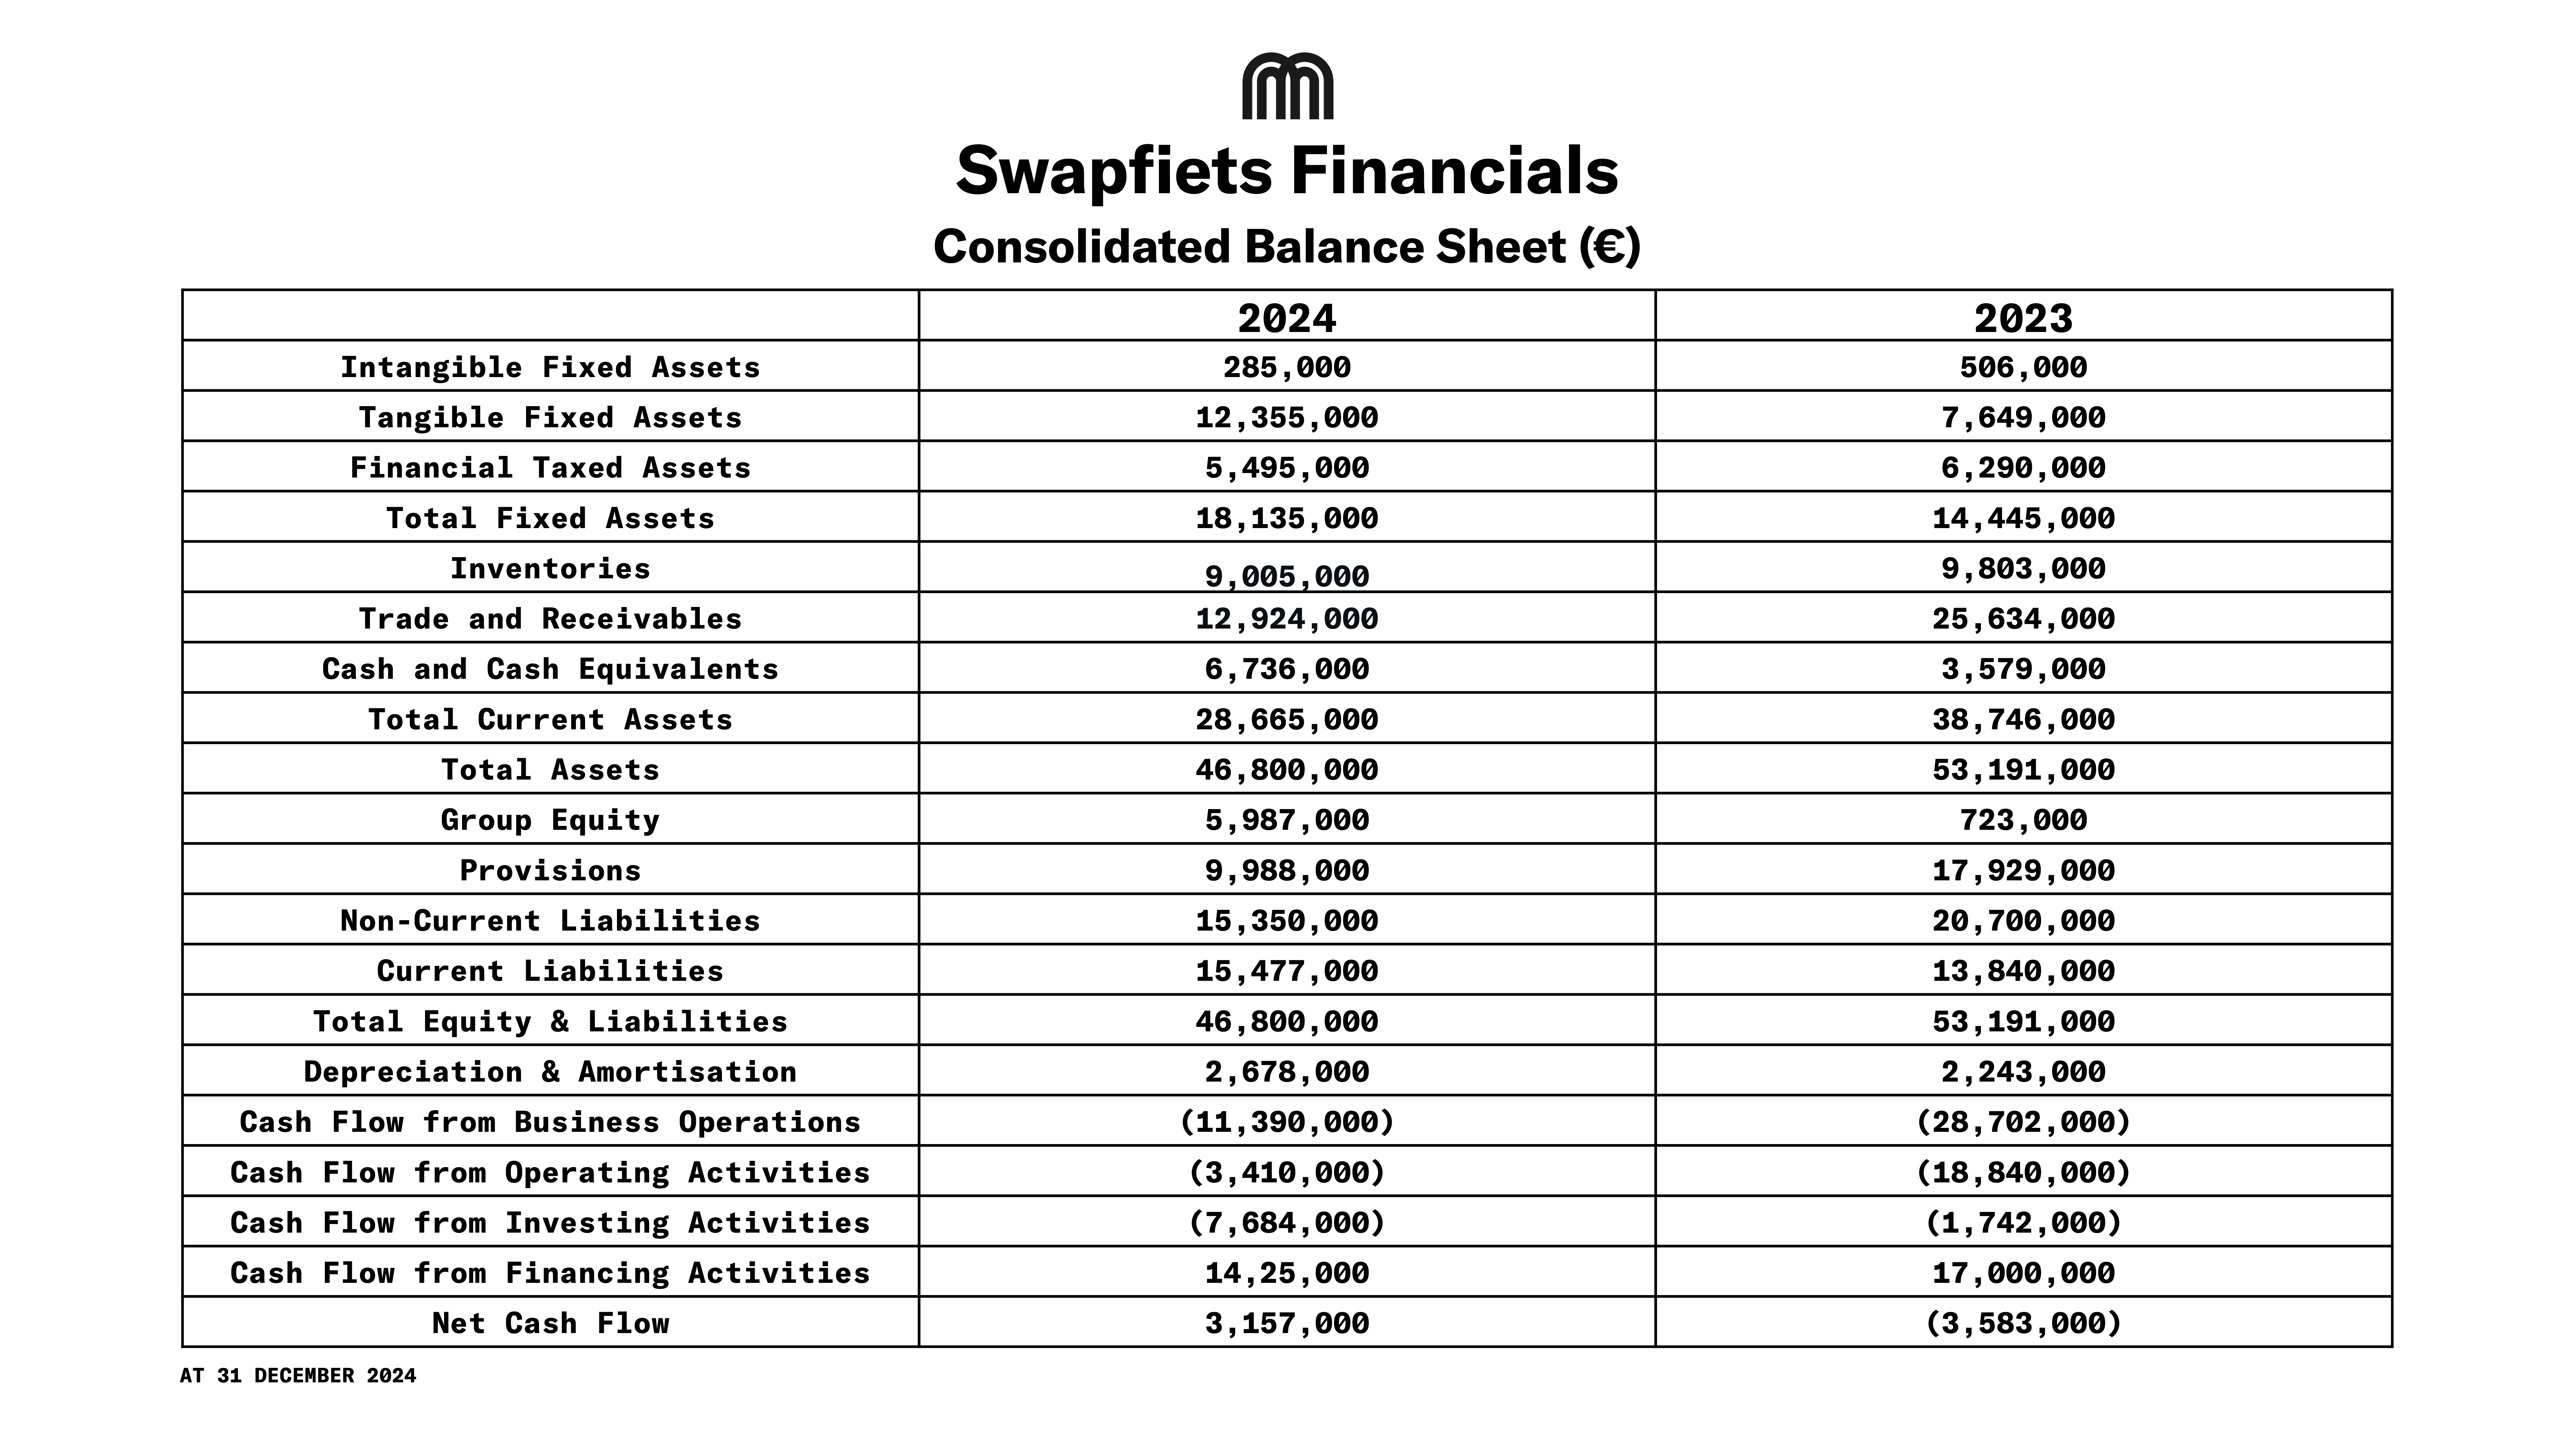
- Table: Balance Sheet Snapshot
- Conclusion
About Swapfiets
Swapfiets is a bike subscription service founded in 2014 by Dutch students Richard Burger, Dirk de Bruijn, and Martijn Obers. Instead of owning a bike, customers pay a fixed monthly fee for access to a high-quality bicycle, e-bike, or e-scooter, with all service, repairs, and replacements included. The idea is simple: if your ride breaks, Swapfiets fixes or swaps it, so you're never without a working bike for long.

Swapfiets today has over 266,831 members and employs 727 people. The company offers a range of five bike models, including two pedal bikes and three e-bikes.
Operations
As of December 2024, Swapfiets operates in 45 cities across 8 European countries (the Netherlands, Germany, France, the UK, Belgium, Denmark, Spain, and Austria).
No new cities were added in 2024. Management's stated focus is on "optimizing growth in these cities" and "continuously reassessing the company’s global footprint."
In 2024, Swapfiets discontinued operations in Italy as part of a deliberate "legal entity rationalisation strategy." All assets and operations were successfully transitioned out, with no material impact on the Group's finances. This move signifies a strategic pivot from rapid expansion to a focused strategy of deepening presence in core markets rather than broadening geographic reach.
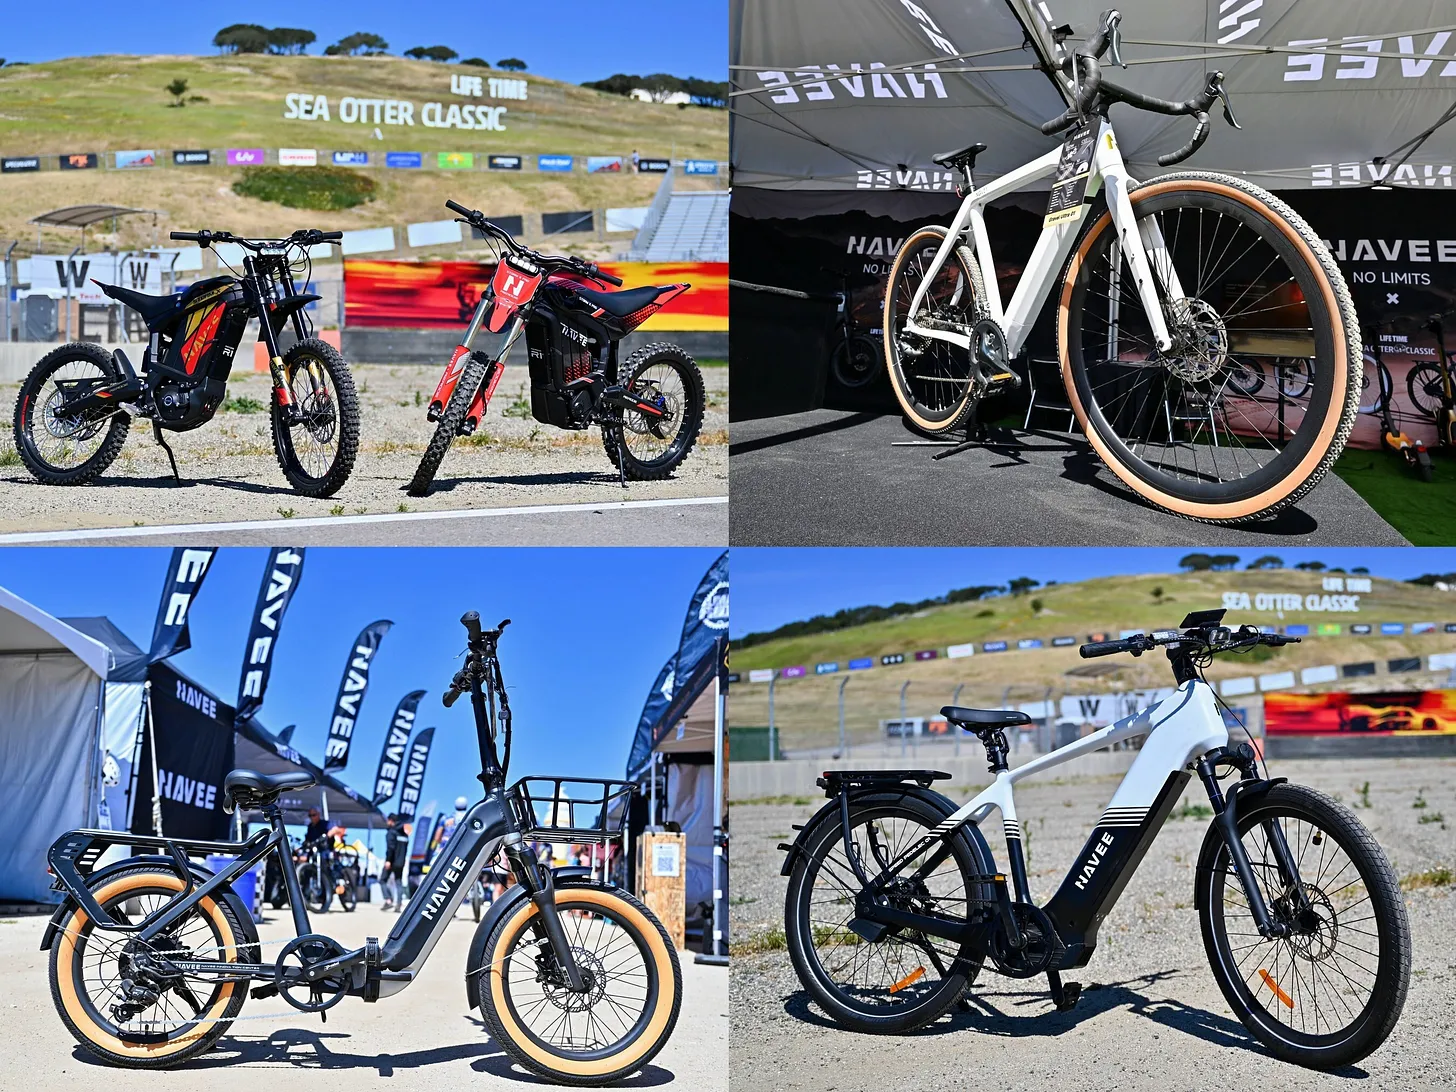
Check this panel from Micromobility Europe where Marc De Vries, CEO of Swapfiets shared some insights
Ownership Structure
Swapthis Holding B.V. remains a 100% subsidiary of Pon Holdings B.V., the Dutch mobility conglomerate. Pon's financial support is the critical enabler of Swapfiets' strategy, providing both equity injections (€19.6m in paid-in capital in 2024) and working capital loans. The group structure includes a holding company (Swapthis Holding B.V.), a central service company (SwapServices B.V.), and individual operating companies in each country.
The company's going concern status is explicitly dependent on the continued financial commitment from its parent company.
2024 Financial Performance
Swapfiets reported €91.1m in revenue, a growth of 7% from €85.3m in 2023. This growth was primarily driven by the e-bike subscriptions, which were complemented by the rise in the e-bike fleet. The number of e-bikes reached 52,000, a 23% increase YoY. E-Bike share in the total membership base rose to 20% in 2024.
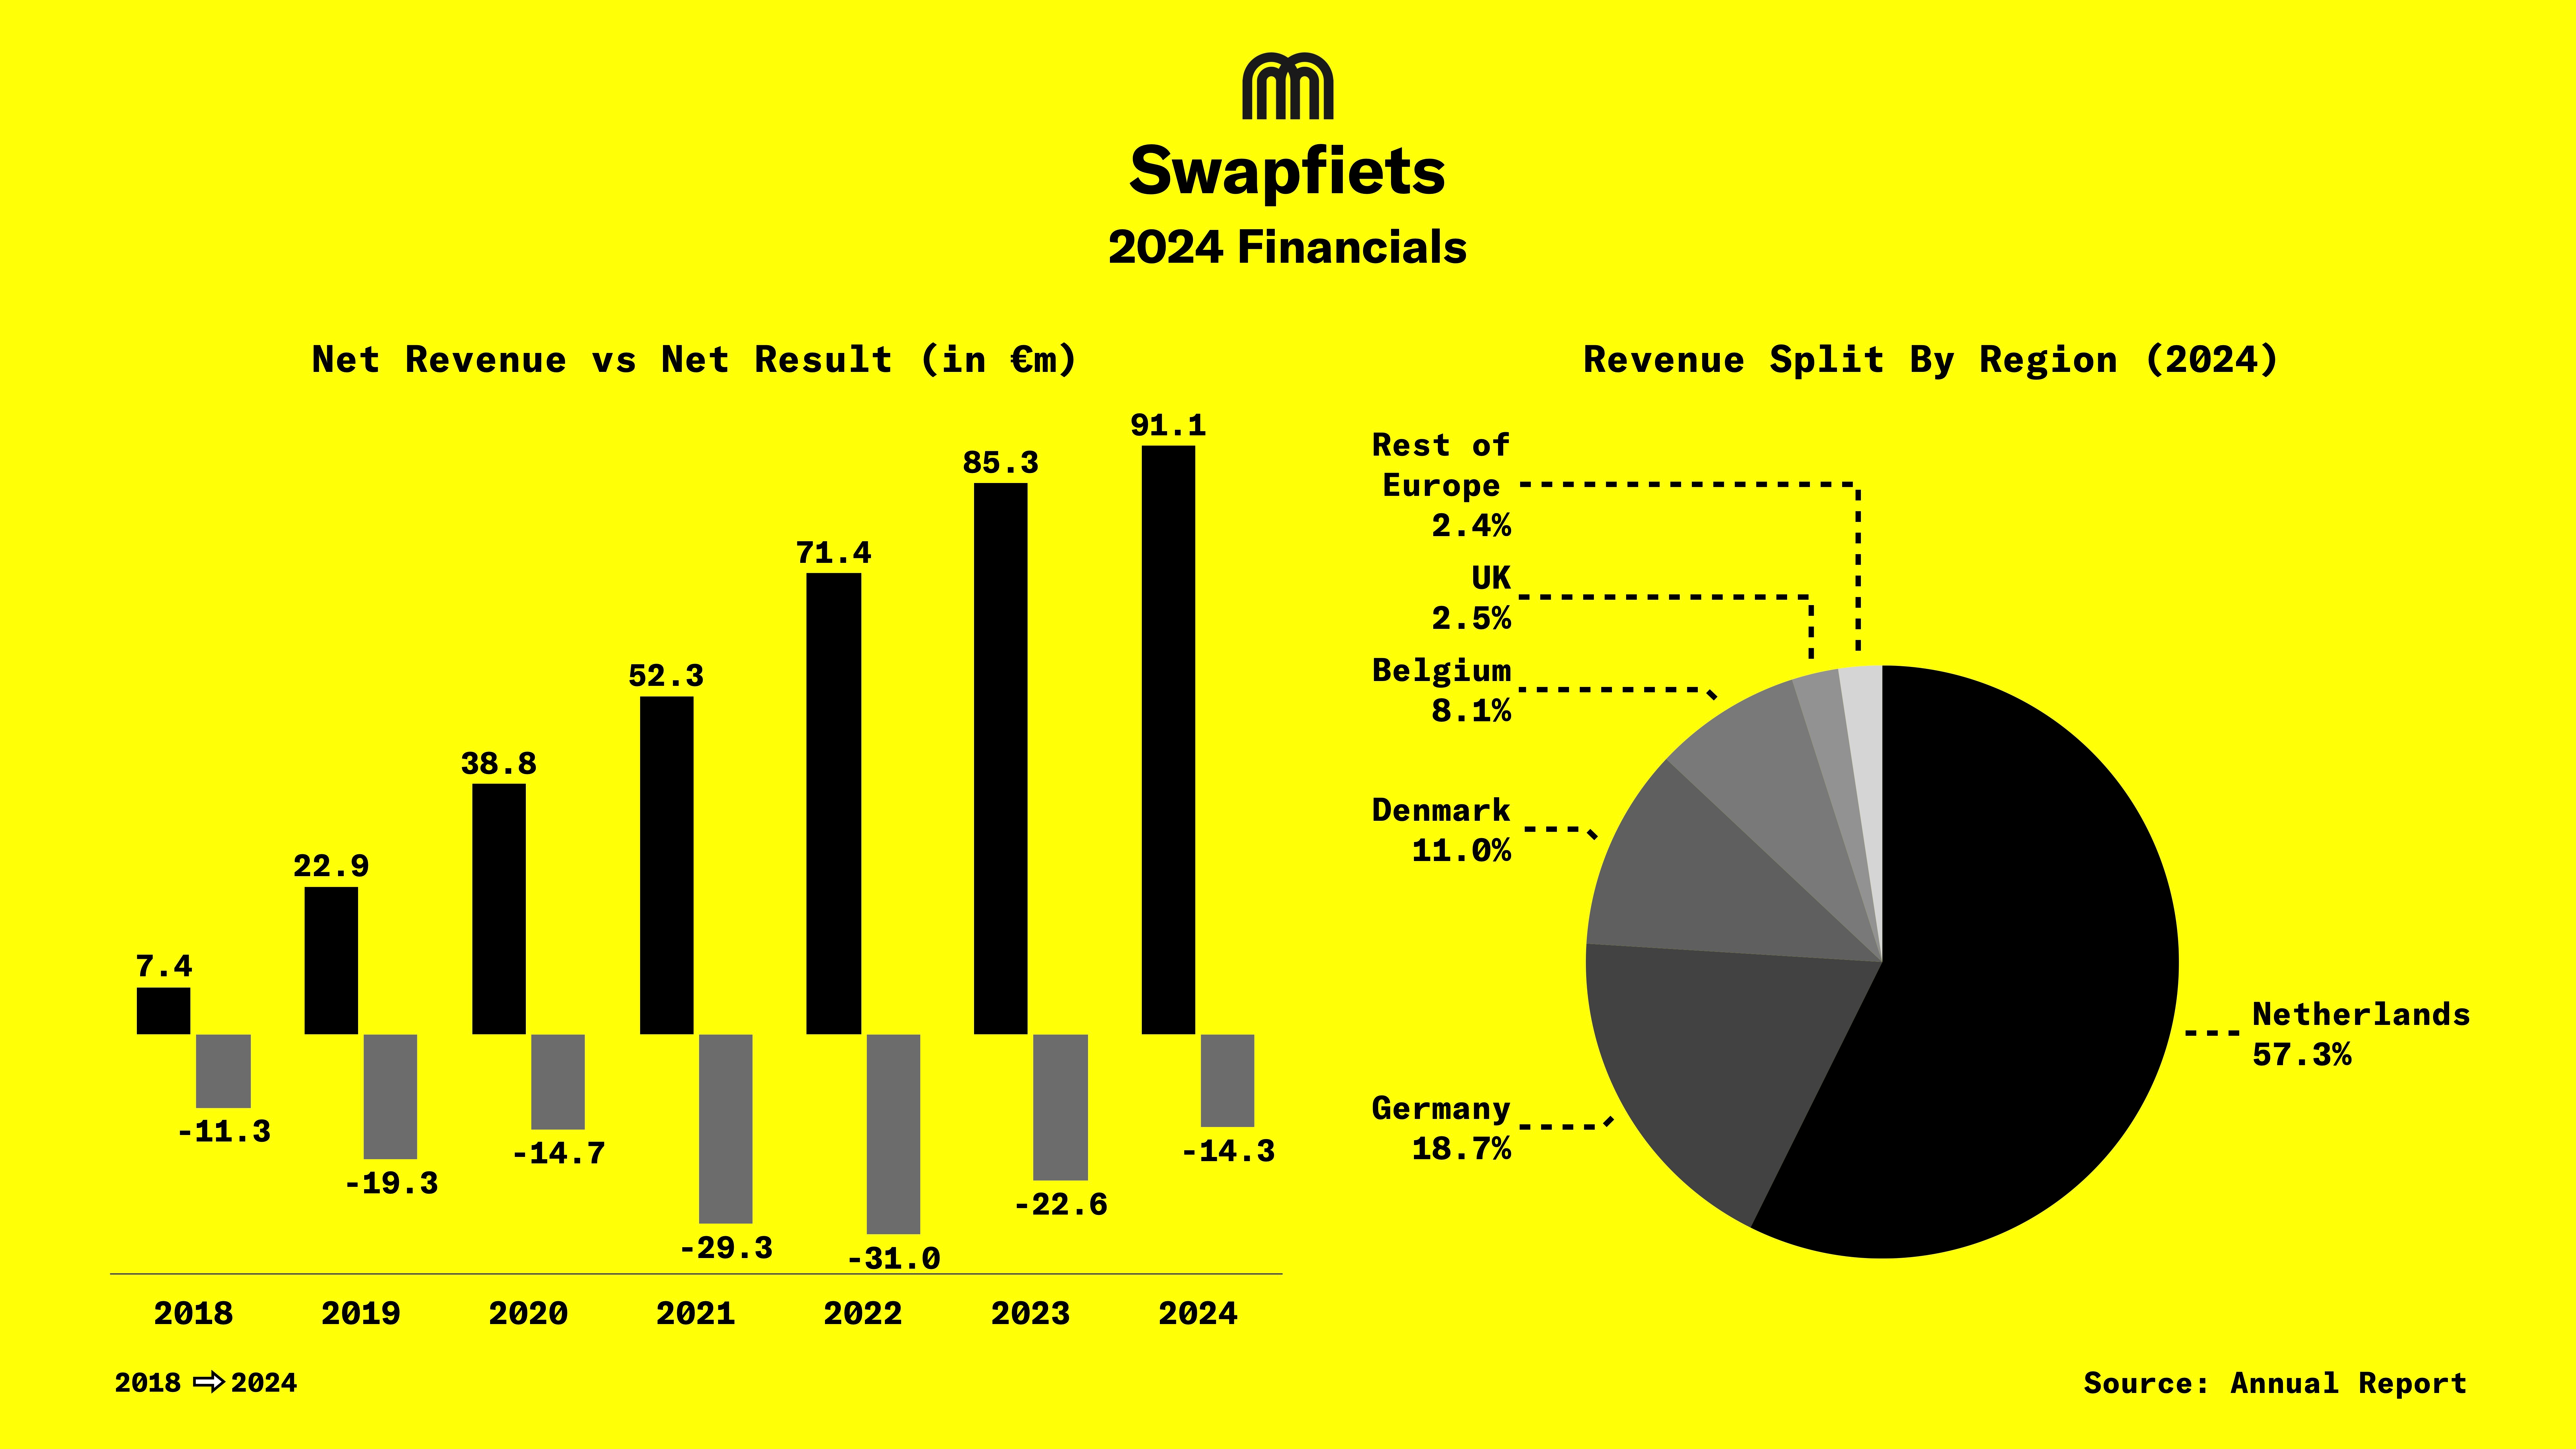
The net loss improved substantially to €14.3m, down from a €22.6m loss in 2023 (an improvement of €8.3m).
Despite revenue growth, the total membership base remained flat at ~266.8k (from 266.2k in 2023). This indicates that revenue growth was driven by upselling existing and new members to higher-value e-bike plans. Average Revenue Per Member (ARPM) has been consistently growing and reached an all time high of €341.41, up 6.5%. At the recent Micromobility Europe Conference in Brussels, Marc De Vries, CEO of Swapfiets mentioned that the average span of a user is ~2years.
Key Financial Metrics:
- Gross Margin: Improved significantly to €30.0 m (32.9% of revenue) from €20.2m (23.7% of revenue) in 2023. This indicates much better control over the direct costs associated with its subscriptions.
- Net loss was €14.33m, an improvement from €22.6m loss in 2023
- EBIT (Operating Loss): Improved to -€17.3m from -€28.4m in 2023.
- Solvency Ratio: Improved to 0.13 (2023: 0.01), though it remains low, indicating high financial leverage and dependence on shareholder support.
- Current Ratio: Stands at 1.85 (2023: 2.8), showing a strong ability to cover short-term obligations, though the decrease is noted due to timing of bike purchases and sale-leaseback transactions.
Revenue Breakdown by Geography
- Netherlands: €52.3m (+14% YoY)
- Germany: €17.0m (Revenue declined by ~10%)
- Denmark: €10.1m (Strong growth, +49%)
- Belgium: €7.4m (Revenue declined by ~16%)
- UK: €2.3m (Minimal growth)
- France: €1.1m (Revenue declined by ~35%)
- Austria: €0.5m (Revenue declined by ~38%)
- Spain: €0.4m (Revenue declined by ~9%)
- Italy: €0m (Market exited)
Revenue remains heavily concentrated in its mature markets, with the Netherlands and Germany comprising over 75% of total revenue.
Cost Structure and Cost Reductions
In 2024, Swapfiets achieved what it had been working toward for years: growing revenue while reducing absolute costs. Despite a 7% increase in revenue to €91.1m, total cost of sales decreased to €61.1m from €65.1m in 2023, primarily driven by significantly improved recovery rates for stolen bikes and reduced bad debt losses.
Marketing expenses remained contained at approximately €3.6m, consistent with 2023 levels. The number of staff decreased slightly from 748 in 2023 to 727 in 2024 (converted to full-time equivalents), with the most significant reductions occurring in German operations.
G&A expenses were maintained at €9.0m, representing just 9.9% of revenue - continuing the company's impressive trend of reducing this ratio from 56.3% in 2018. This demonstrates sustained operational leverage and scalability in the business model.
Interest expenses increased to €1.6m from €1.2m in 2023, reflecting higher interest rates on outstanding debt facilities. Expenses linked to Directors remuneration were not separately disclosed in the 2024 report, but historically represented a small portion of overall expenses.
Depreciation & Amortization costs remained stable at €2.7m, as the company continued utilizing sale-and-leaseback transactions for fleet financing. Operating loss (EBIT) narrowed significantly to €17.3m from €28.4m loss in 2023.
At the end of 2024, the company set aside €9.99m in provisions for bikes, down from €17.93m in 2023. This includes €7.7m for onerous contracts, mainly covering bikes missing or not returned by customers, €2.2m for broken bikes stored in warehouses, and €39k for rental costs linked to closing locations. The decrease compared to 2023 reflects fewer missing and broken bikes.
Provision for Spare Parts
At the end of 2024, the total spare parts inventory was €10.2m, but after subtracting €1.2m for old/unused (obsolete) stock, the final value was €9m (slightly lower than €9.8m in 2023). These spare parts are used as collateral for a €6m working capital loan from DFM. During 2024, the company recorded €7.6m worth of spare parts as expenses in its profit and loss account (P&L). The company introduced SAP software to track spare parts more accurately across locations. This made it easier to spot slow-moving items, which is why the amount set aside for obsolete stock increased.
Cash Position and Debt Restructuring
Swapfiets was net cash flow positive in 2024 with €3.15 in net cash, a recovery from €3.5m in negative cash flow in 2023. Cash flow from business operations was negative at -€11.9m, while operating cash flow (after interest and taxes) improved to -€3.4m in 2024, a significant recovery from -€18.8m the previous year.
The company invested €6.5m in fleet expansion, a substantial reduction from the €23.5m invested in 2023, reflecting a strategic shift in growth funding. Swapfiets continued to utilize its sale-and-leaseback model, selling €6.3m in assets to VWPFS. A key strategic move was the repurchase of €6.5m worth of bikes from the leasing company. These bikes, now owned outright by Swapfiets, have no associated lease costs, which is expected to improve future unit margins.
To strengthen its balance sheet, Swapfiets received a €19.6m equity injection from its parent company, Pon Holdings, up from €13m in 2023.
At the end of 2024, the company had long-term debts of €15.35m, down from €20.7m in 2023. This includes €6m borrowed from DFM, which has an average interest rate of about 5.5%.
The remaining €9.35m is money borrowed from the parent company, Pon Netherlands B.V., with an interest rate of about 7.3%. This loan is treated as capital at year-end, and the effective working capital loan interest was 5.6%.
Swapthis Holding B.V., Swapfiets B.V., SwapServices B.V. and Swapfiets Procurement B.V. are part of the fiscal unity of PON Holdings B.V. Since 2020, Swapservices B.V. takes the lead role in deciding what products are sold, where they’re sold, and at what price, across all countries.
The company can use earlier financial losses (before joining PON) to reduce future taxes, and expects to use these benefits within three years. SwapServices B.V. also had €2.2m in losses before joining PON, but these are not counted for tax benefits.
Conclusion
At my opening keynote at Micromobility Europe 2025, I highlighted a Swapfiets chart to explain why I remain bullish on different micromobility business models. Once again, Marc De Vries did not disappoint, as he is steadily steering the company closer to profitability.
What stands out is the consistent improvement in average revenue per user, a strong signal of pricing power and customer adoption of higher-value plans. The company also generated ~€3.1m in net cash, marking a return to positive cash flow. While operating cash flow remains negative, 2024 showed a significant recovery compared to prior years.
The big question now is strategy: will Swapfiets double down on core markets that are growing, possibly even exiting underperforming regions like France, or pursue further expansion, particularly in Germany where the addressable market remains huge?
Twitter | YouTube | LinkedIn | Instagram | Blog | Podcast


.png)


