
.svg)
%2Bcopy.jpeg)

.svg)


Contents
- Introduction
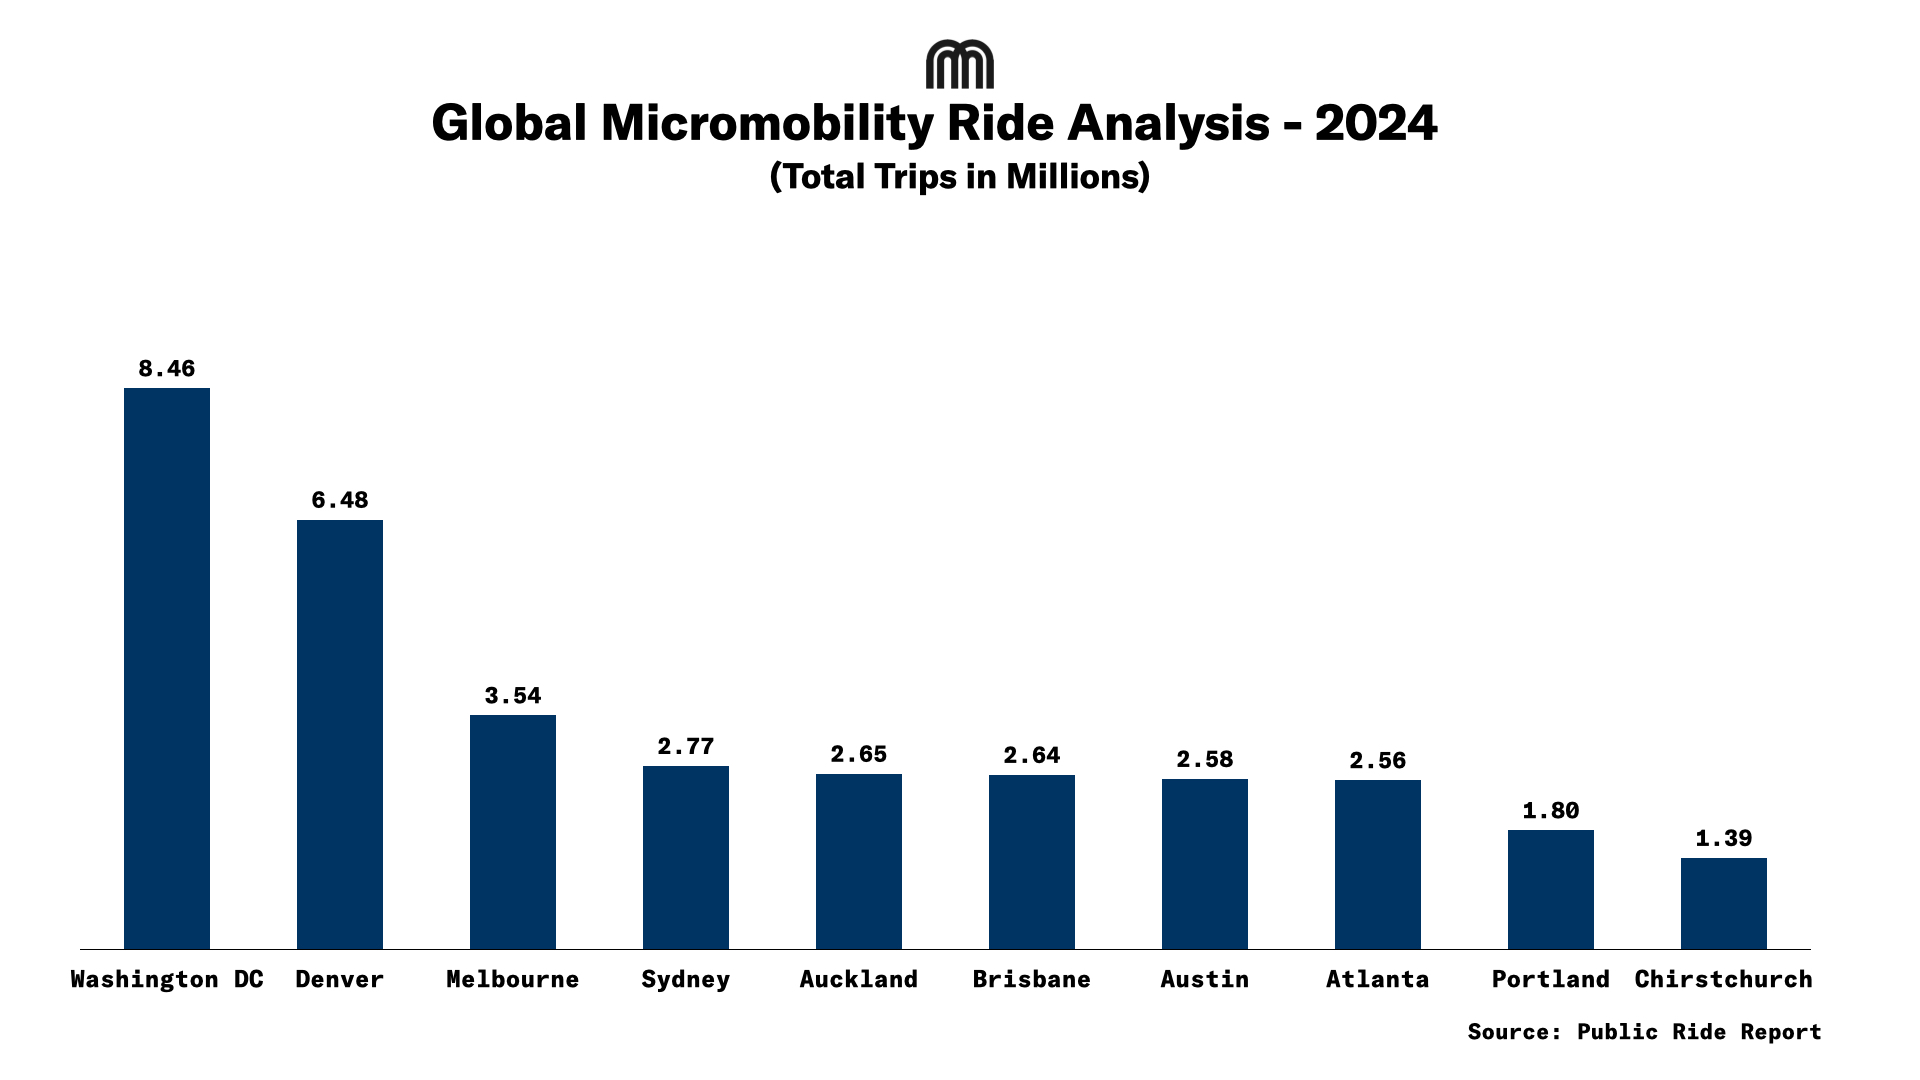
- Chart: Trips in Cities - 2024
- Global Micromobility Ridership Analysis
- Performance Breakdown
- Chart: Quarterly TVD of Top 5 Cities till Q1-2025
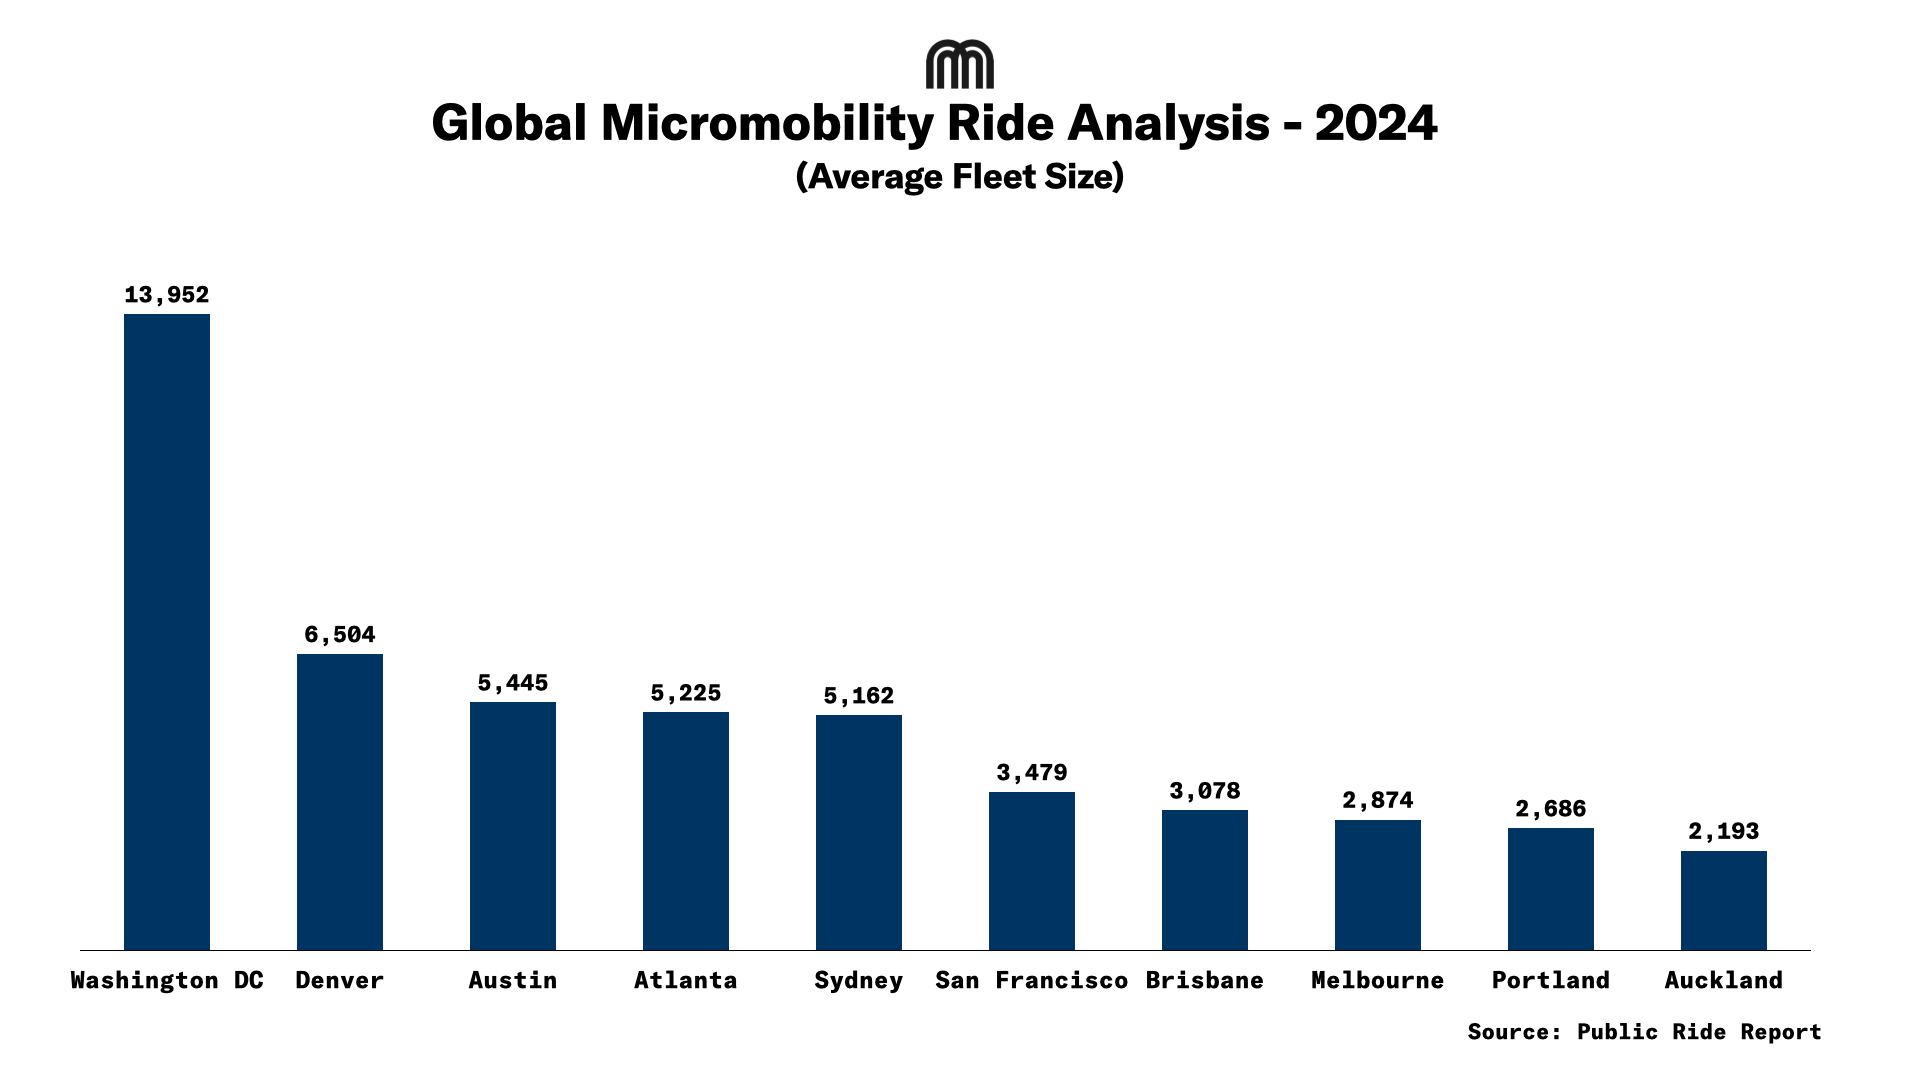
- Chart: Average Fleet Size by City in 2024
- Quarterly Trends
- Insights
- Conclusion
Introduction
Micromobility operators face a pivotal shift from scale-driven growth to efficiency-focused operations in 2024-2025. While annual ridership reached significant volumes across major markets, performance diverged sharply based on fleet utilization metrics. Leading cities demonstrated that strategic fleet optimization, rather than sheer vehicle count, drives sustainable outcomes, particularly when navigating seasonal volatility.
Washington DC reported 8.46M annual rides and Denver demonstrated fleet efficiency with 2.80 TVD avg. Melbourne's operational overhaul boosted Q1 2025 performance (0.47M) despite seasonal headwinds. These granular insights redefine 2025 priorities around fleet optimization and seasonal resilience.

Global Ridership Analysis
Boulder dominated with good utilization (4.07 TVD avg), while Sacramento struggled with severe underperformance (0.84 TVD avg), highlighting extreme operational gaps. Denver maintained strong efficiency (2.80 TVD avg) despite seasonal volatility, whereas Washington DC's scale (13,952 vehicles) contrasted with low TVD avg efficiency (1.65). Melbourne demonstrated strategic optimization through its fleet reduction while achieving robust performance (3.32 TVD avg). Seasonal impacts were evident in utilization fluctuations, though these dynamics are best analyzed through quarterly TVD average trends beyond this annual view.
Performance Breakdown
Washington, D.C.
- Closed 2024 with 8.46 million rides, including 5.45M on e-scooters and 3.02M on bikes
- Saw a 23% drop in Q4 rides (2.86M → 2.21M) following a fleet reduction from 14.97K to 13.2K
- Trips per vehicle per day declined from 2.13 in Q3 to 1.78 in Q4
- Q1 2025 rebounded with 1.57M rides, up 39% year-over-year, with the fleet steady at ~13.8K
Denver
- Delivered the highest consistent efficiency in 2024 at 2.80 trips per vehicle per day
- Maintained strong Q4 ridership with 1.53M trips, despite winter, using a 6.24K-vehicle fleet
- Q1 2025 saw efficiency rise to 1.78 trips per vehicle per day, a 13% year-over-year increase
Melbourne
- Reduced fleet size nearly 10% year-over-year (3.2K → 2.8K) but still logged 3.54M rides in 2024
- Average trips per vehicle per day dropped from 3.8 in 2024 to 3.32 in early 2025
- Q1 2025 saw a sharp drop in ridership, down 64% YoY to 470K from 1.31M the year before
Austin
- Achieved steady quarterly growth through 2024, from 550K rides in Q1 to 720K in Q4
- Cut fleet size by 26% (7.4K → 5.4K), which helped boost utilization to 1.32 trips per vehicle per day
- Kicked off 2025 with 600K rides in Q1, up 10% YoY, maintaining 1.24 trips per vehicle per day
Sydney
- Finished 2024 with 2.7M total rides, a 67% increase from 2023, with 940K in Q4 alone
- Doubled its fleet over the year, from 2.6K to 5.1K vehicles
- Continued strong performance in Q1 2025 with 1.45M rides, up 95% year-over-year
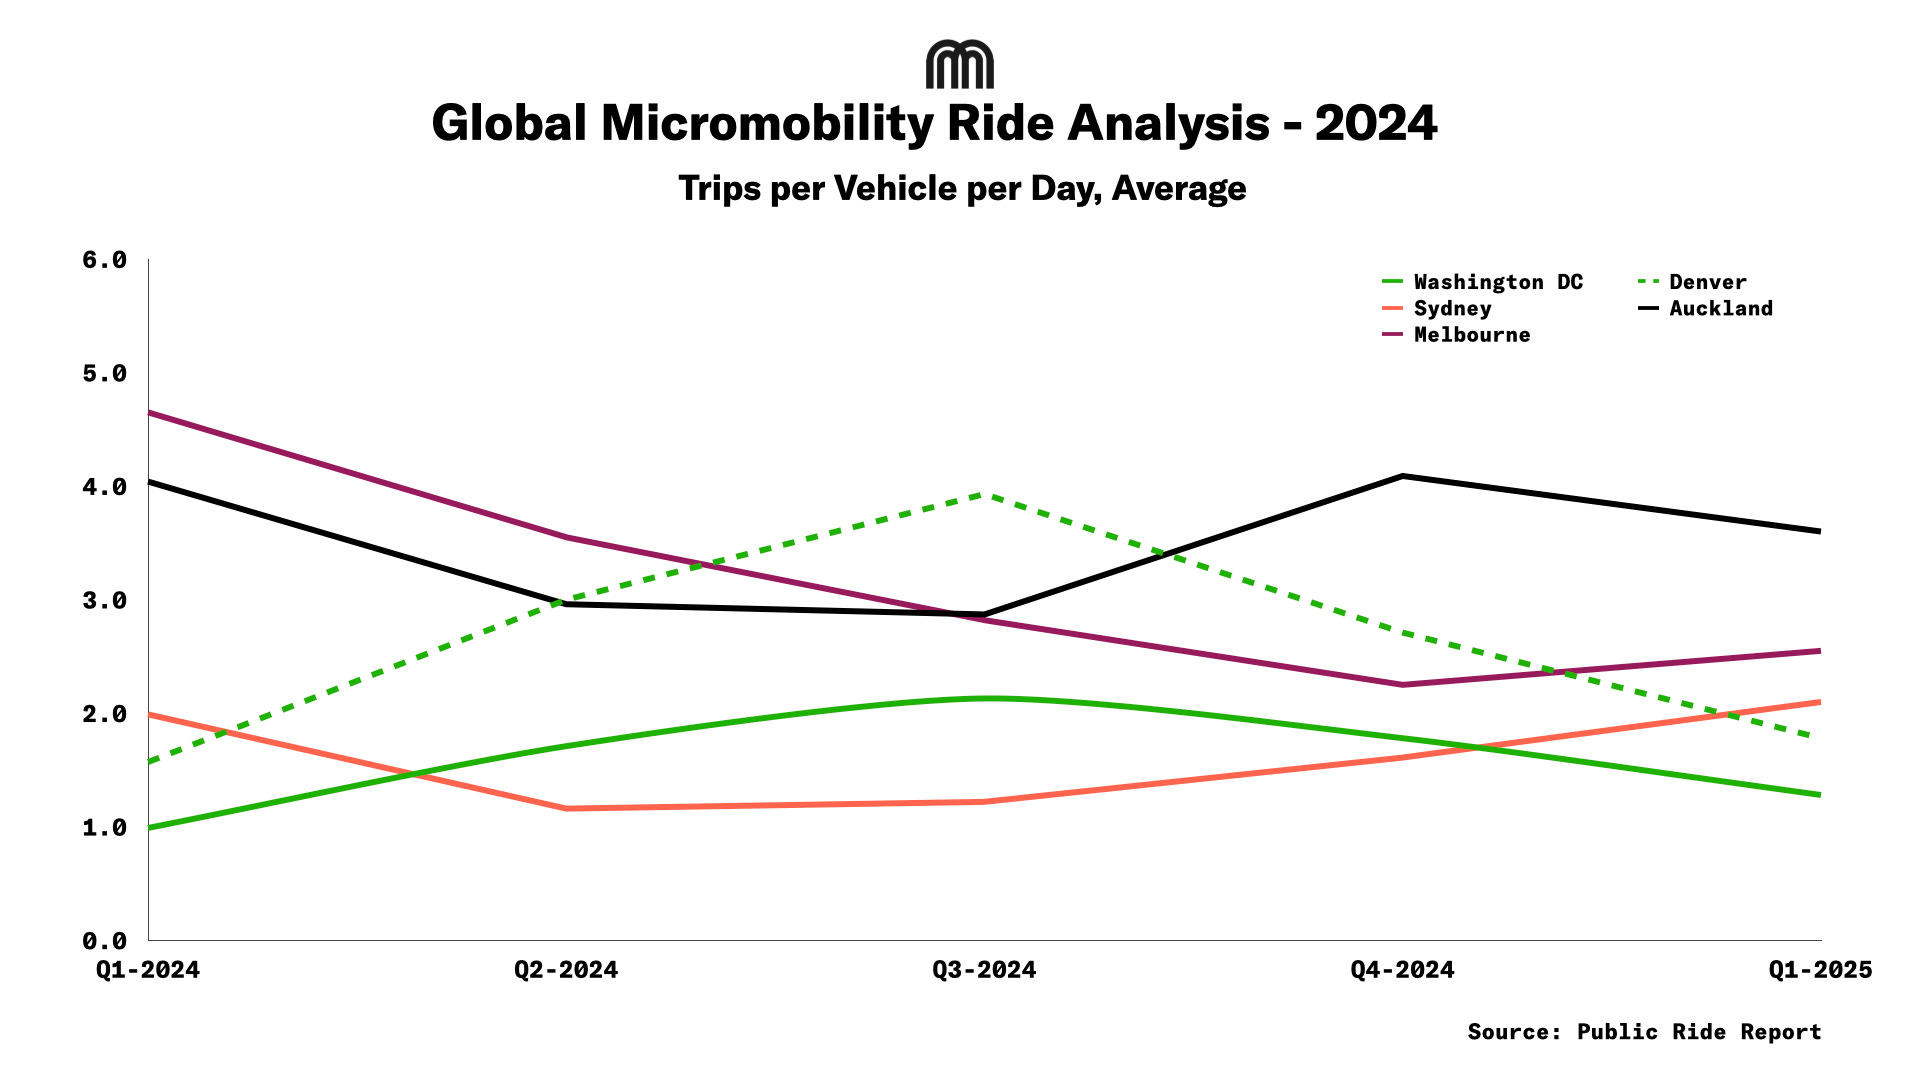
Quarterly Trends
Seasonal Efficiency Swings
Cold-weather utilization plummeted in key markets: Denver’s efficiency fell 52% (2.71 TVD in Q4-2024→ 1.78 TVD in Q1 2025).
Similarly, in Sydney during the Australian winter in 2024, the TVD was as low as 1.22; however, the numbers reached a new high in Q1-2025 with average TVD of 2.1
2025 Efficiency Leaders
Boulder (4.07 TVD Avg; 999 Vehicles), Auckland (3.49 TVD Avg; 2,193 Vehicles), and Melbourne (3.32 TVD Avg; 2,874 Vehicles) led utilization. These cities exemplify high-rotation fleets aligned with demand patterns.
Underperformers
Sacramento (0.84 TVD Avg; 1,685 Vehicles), Phoenix(0.90 TVD Avg; 1,296 Vehicles), and San Francisco (1.10 TVD Avg; 3,479 Vehicles) highlighted vehicle oversupply. Excess capacity suppressed efficiency despite moderate ridership volumes.
Insights
- Right-Scale Fleets: Melbourne’s 10% vehicle reduction proves smaller and optimized fleets outperform bloated operations (e.g., Boulder’s 999 vehicles vs. Phoenix’s 1,296)
- Weather-Proof Utilization: DC’s 39% Y-o-Y increase in the number of rides in Q4-2024 shows targeted winter incentives work
- Operational Efficiency: Auckland’s 3.49 Avg TVD in 2024 outperformed Sydney’s Avg TVD of 1.50, demonstrating the impact of fleet optimization beyond density metrics.
Conclusion
The 2024-2025 transition marks micromobility’s shift from scale to efficiency. Markets like Boulder and Auckland proved that optimized fleets (≤2,000 vehicles) with average TVD of 3.5+ outperform larger, underutilized operations. As Q1 2025 data shows, winners will be determined by utilization metrics, not sheer ride volume. The imperative is clear: rightsize fleets, target density hotspots, and transform seasonal vulnerability into year-round efficiency.
.png)


