
.svg)
%2Bcopy.avif)

.svg)
.jpg)
%20(1).jpeg)
.jpg)


.webp)

The most important step in the analytical process is asking the right questions. The reasons we study the auto industry is because we define micromobility as that which isn’t automobility. Micromobility is negative space so to see it we need to see the positive space.
Unlike micromobility, automobility is not lacking in data. There are many suppliers of industry data with some overviews available for free. Most producers are public companies so we can learn quite a bit about their economics. The only problem is actually that there is too much data and filtering it and seeing useful patterns takes time.
This will be a series of posts on the auto industry. How to think about it, how we got to where we are and how it will change.
So where do we begin?
The first thing is to understand the unit of measure: the car industry measures output in terms of vehicles. There are vehicles produced and vehicles sold and vehicles registered and vehicles in use. Furthermore there are categories of vehicles. We like to point out that the dividing line between automobility and micromobility is found in your wallet: the driver’s license identifies a car user and a car is the thing you need a driving license to use. In contract there is no “rider’s license” thus everyone is a rider.
But in automobility, there are very clear distinctions between vehicles because licenses (and insurance policies and regulations and taxes, tolls, parking, etc.) are all indexed on vehicle types. The highest level distinction is between passenger cars and commercial vehicles. Commercial vehicles are further divided into light and heavy trucks and buses. Then there is production/sales/registered by country and region. Lately we’ve begun to see further distinction by power/fuel source: electric vs. hybrid vs. plug-in hybrid vs. diesel, etc. We also are seeing quarterly, monthly and even weekly data.
Each country reports data through associations and there is a global aggregator (OICA.net).
So the top line, according to OICA, is: global sales of passenger cars were 64,035,567 vehicles in 2019, 53,917,153 in 2020 and 56,398,471 in 2021. Including commercial vehicles, global sales were 91,227,182 vehicles in 2019, 78,774,320 in 2020 and 82,684,788 in 2021. (Note the precision: we can count to the last unit.)
Because 2020 and 2021 were both demand and supply constrained due to Covid, the 2019 numbers are more representative of the market. For this reason, it’s a simple rule of thumb to say that automobile demand is in the 100 million unit range of which 65% is personal and 35% is commercial vehicles. The other figure to remember is that the entire global “fleet” of vehicles is about 1.4 billion. If quantities don’t change year-to-year, dividing the fleet by the yearly sales gives a turnover or average replacement time of 14 years. This is actually pretty close to the average vehicle age in the US fleet.
So when you hear a company report production/sales figures e.g. 250,000 vehicles in a quarter, you can roughly estimate share as 0.25 million/ 25 million (quarterly) or 1%.
This leads to the next layer of analysis: the companies involved. Here there is another complication: the vehicle brands are what people buy but brands change ownership and are subject to “badge engineering” where some companies manufacture vehicles for other brands in “alliances” of joint ventures. For example Jaguar, a legendary UK brand was merged with Land Rover and purchased by TATA Motors, an Indian company. Is a Jaguar then a TATA or a JLR? Is it English or is it Indian?
Rather than following the brands, it pays to follow the money and look at the manufacturing groups. They are the public companies which report on and are traded according to production and sales.
If we look at the industry as a collection of companies, we can start to make additional observations. For instance, are there many participating companies? Is the number growing or shrinking? Is the structure one of a long tail: a few very large and many small? Are the companies becoming more valuable or less. How has all this changed over time.
By looking at the financial metrics we can form theses on the evolution of the industry.
In this post, I’ll focus on which are the major operating groups and how to categorize the field.
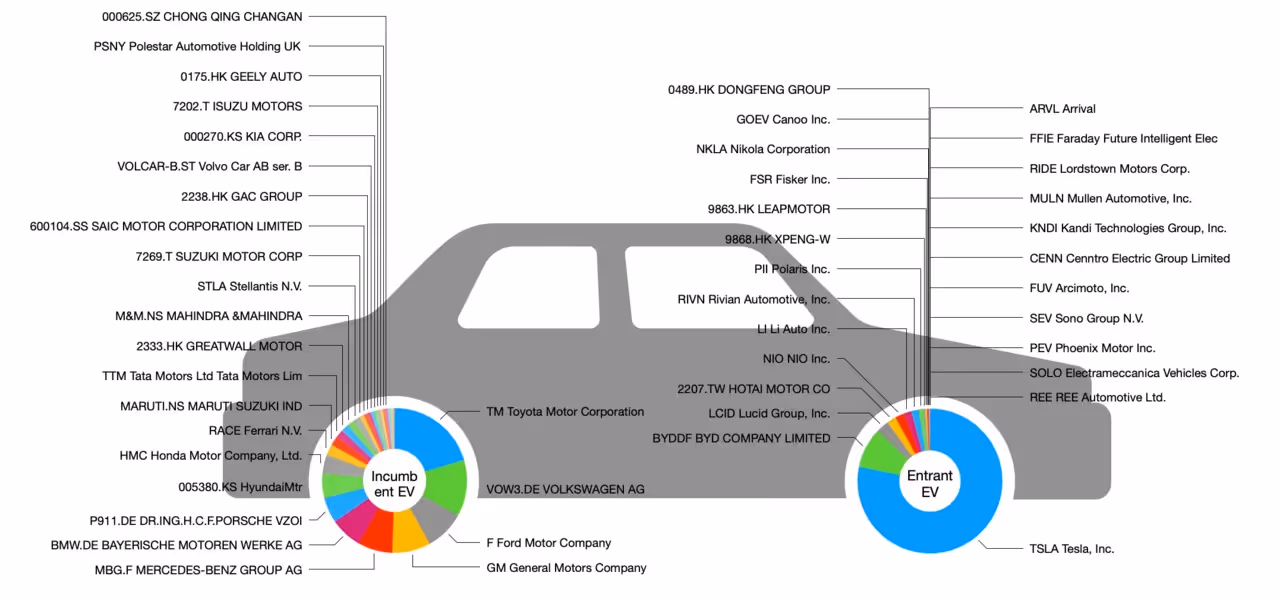
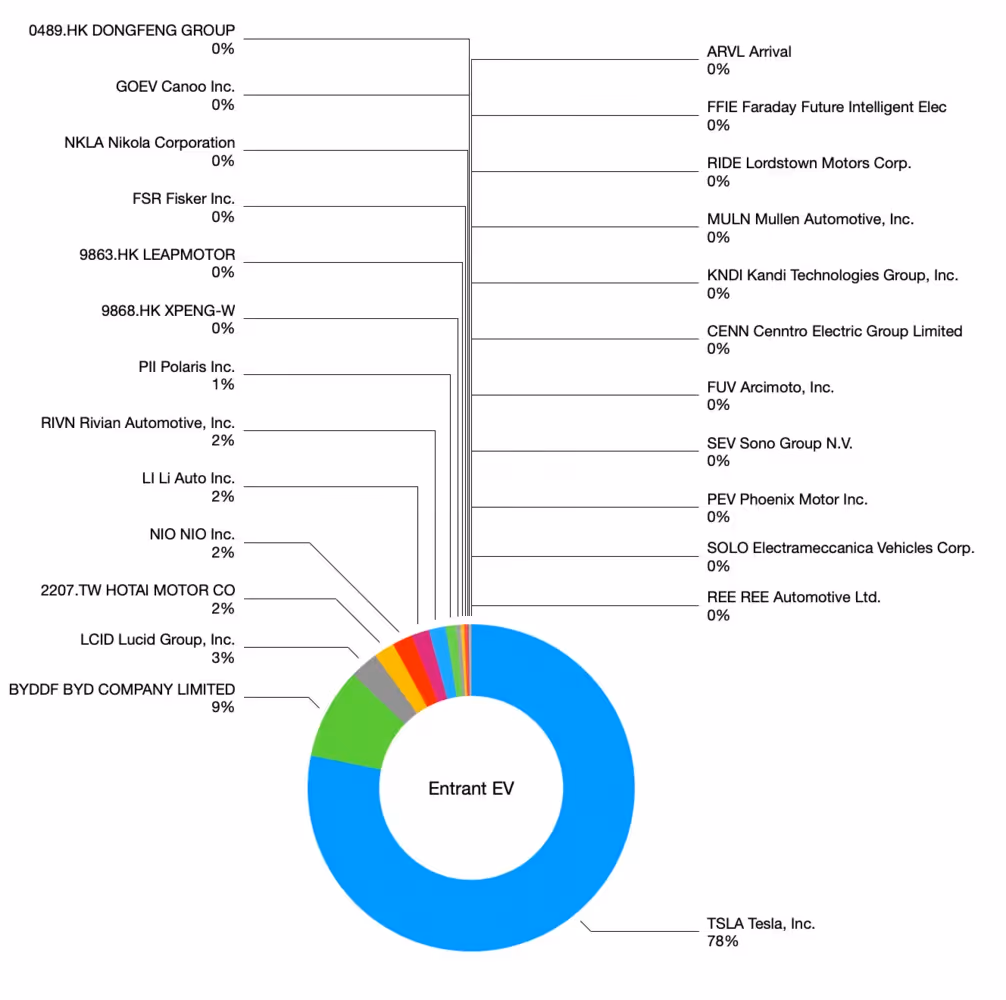
My list consists of 56 companies divided into two groups: incumbents and entrants. Entrants are younger than 20 years, while Incumbents are older. There are 31 incumbents and 25 entrants. They are listed in the graph shown below. Note that each is shown by its stock ticker symbol and the formal company name.
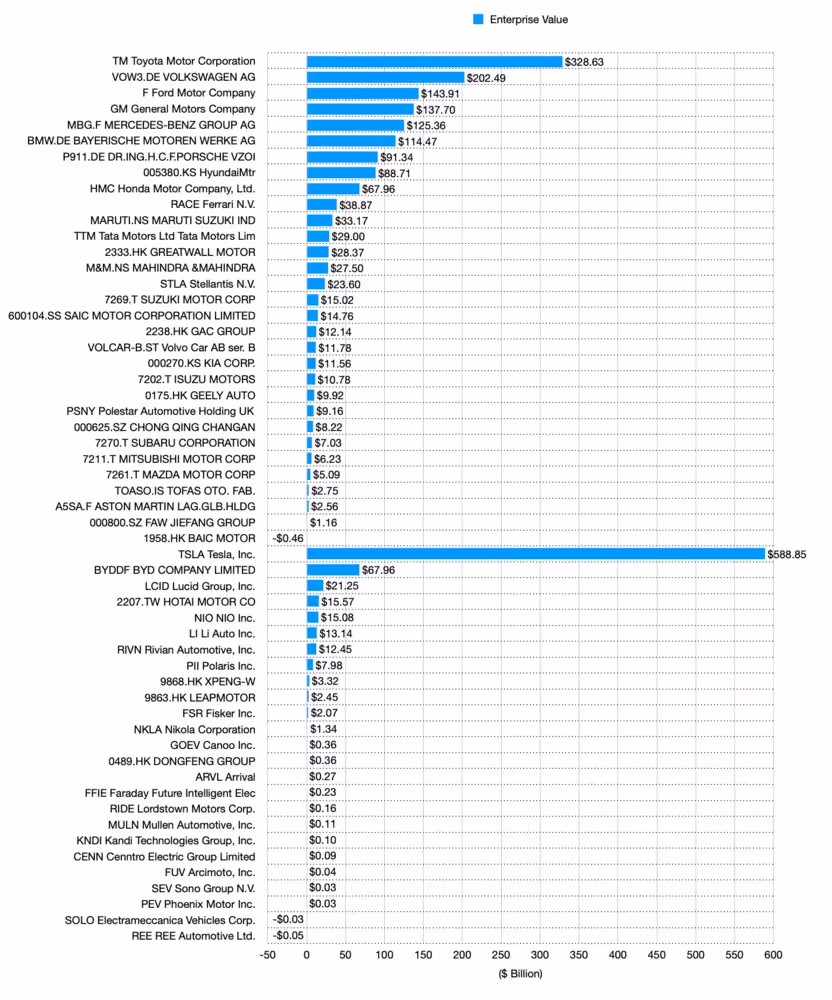
The incumbents are shown in the top of the graph and the entrants in the bottom. Each bar shown is the company’s respective enterprise value.
Now a word about what this is and why it's important. The enterprise value (EV) of a firm is its market capitalization minus cash plus debt. It represents the amount of cash needed to acquire the company or how much it would be worth on the basis of future value and non-liquid assets.
This is a better measure in an industry which uses a lot of debt financing as a market capitalization alone only measures equity value not debt or cash value and debt is important in the auto industry. For example, VW group has a market cap of about $79 billion but $202 billion in EV. The EV represents more accurately what it would cost to acquire and how much future cash flows are currently valued.
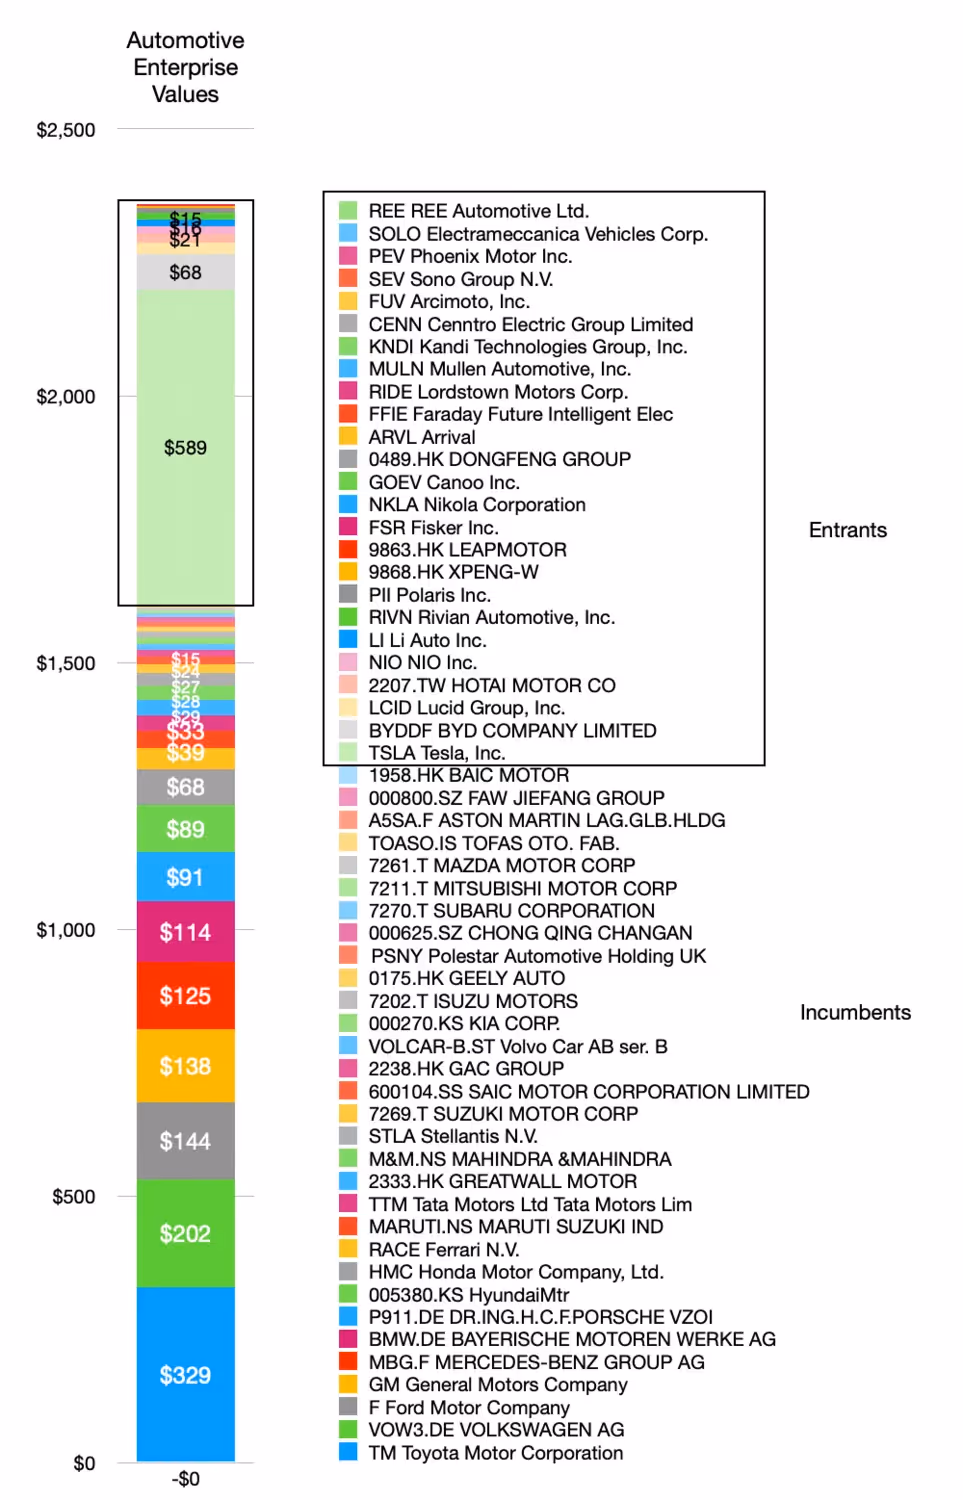
If we sum up the EV of the categories, we get $1.6 trillion for incumbents and $753 billion for the entrants. A respectable showing by entrants suggesting that there is significant value flowing from newcomers and that there is room for them.
However the concentration of value is different: Top 4 incumbents make up half the incumbent value and top 8 make up 75% whereas one entrant makes up over 75% of the entrant value. The entrant picture is dominated by one company: Tesla. Actually, Tesla has the largest value of all companies, being almost double the EV of the second largest (Toyota).
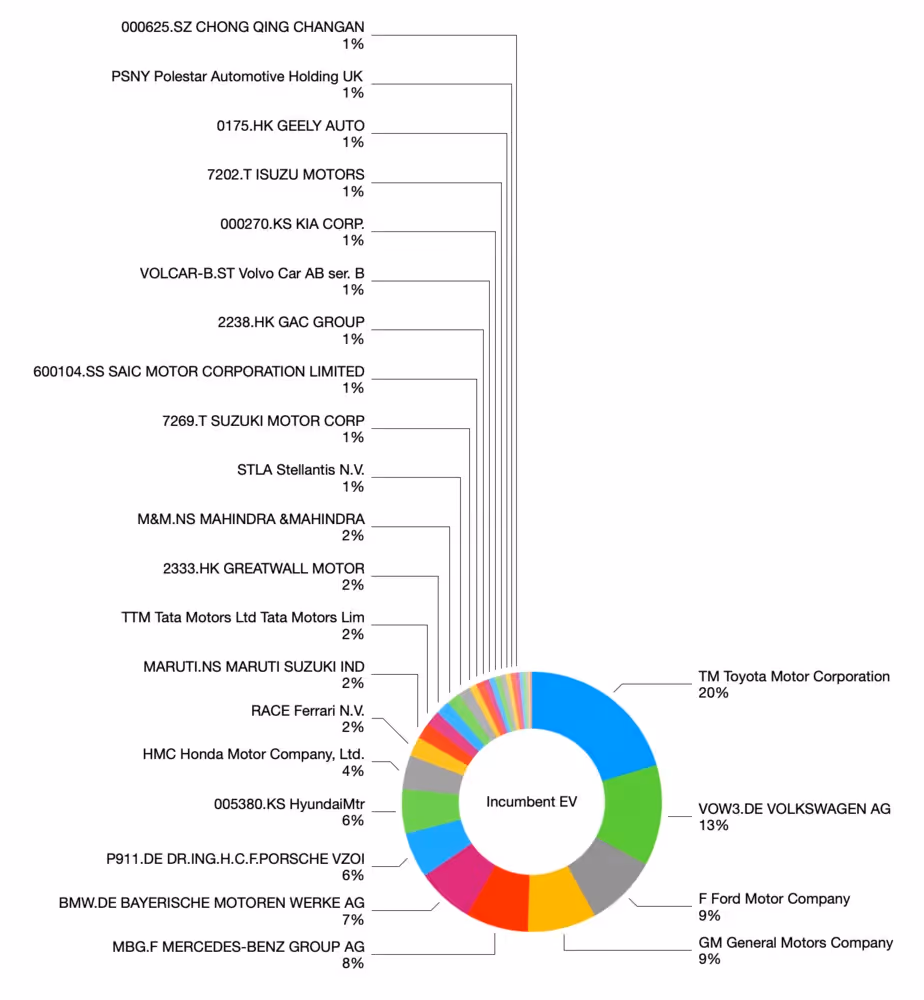
There are many stories in this data and scanning through the names you might be surprised at the relative strengths or weaknesses of particular brands. For instance why Porsche is so valuable relative to its parent VW, who still owns the vast majority of it, and why Ferrari and Polestar were made independent through IPOs. Or why Mahindra is worth more than Stellantis, the home of the brands of Abarth, Alfa Romeo, Chrysler, Citroën, Dodge, DS, Fiat, Jeep, Lancia, Maserati, Mopar, Opel, Peugeot, Ram and Vauxhall.
But these discussions will wait for another day. The main focus I’ve forced here has been by splitting the list into this particular dichotomy: entrant/incumbent.
This matters above all because the industry has been very slow to allow entry and it has only been through a process of national industrialization. In other words, automobile companies entered their markets as national champions: when France was mobilized, Renault was the reason; when Germany joined the club, VW was the reason. Same with Japan and Toyota, USA and Ford, Korea and Hyundai. As the number of nations became motorized, they did so with the development of a local industrial producer of cars.
Thus most recently China has added its champions and India is in the process of adding its own today.
But this new crop of entrants, this century, are all electric car makers. In particular, again, Tesla (and BYD—stay tuned for more on this). Is this evidence that automotive entry is no longer a matter of nationalistic industrial policy? Is it really a matter of, dare I say it, innovation?
And if it is innovation, what does it imply about micromobility?
The keen eyed might notice a few names on the list that don’t fit the automotive mold. Arcimoto, Polaris, Kandi and Electrameccanica are not car makers. A hint perhaps that something is on the horizon beyond electric, or rather, because of it.


